Daily Charts

610,141 Views | 2786 Replies | Last: 2 yr ago by AggieUSMC
bmet
How long do you want to ignore this user?
AG
Nice data for Texas from TAMU CC. Multiple tabs/charts where you can break things down to county-by-county basis, etc:
https://tamucc.maps.arcgis.com/apps/opsdashboard/index.html#/7b82e7fc0e2142cf9a07aa9f7ce5b87f

ham98
How long do you want to ignore this user?
bmet said:

Nice data for Texas from TAMU CC. Multiple tabs/charts where you can break things down to county-by-county basis, etc:
https://tamucc.maps.arcgis.com/apps/opsdashboard/index.html#/7b82e7fc0e2142cf9a07aa9f7ce5b87f


cool
BlackGoldAg2011
How long do you want to ignore this user?
AG
I haven't seen this look yet but decided to look into estimating what our actual case load might look like based on various CFRs. We all know we don't know the "denominator" so here are some looks ate a few different scenarios

Methodology: To come up with these estimated case load curves, I assumed the death count trails the case count by 2 weeks, so I took the death total for each day, and use that and the stated CFR to estimate what the total case load was 14 days earlier. For the 2 most current weeks, where 2 week out death numbers are not available, I looked at what the recent trend of the ration of estimated cases to confirmed cases was doing and carried that trend out for 2 weeks and applied that multiplier to the confirmed case count to get the estimated case count. here is a look at that ratio trend for illustration:


A few notes:
  • First, 0.02% CFR is currently the absolute lower limit for possibilities, because this means that every single person in the USA currently has been infected by COVID-19. So not the lowest feasible CFR, but the lowest that is physically possible.
  • If the CFR is the same as the flu (0.1%), we have already surpassed the worst flu year in the last decade by 44% and just breached the upper bound of the estimated H1N1 case load from the 2009 pandemic at only 6.5 weeks into the pandemic. Also, if not a singled person more gets COVID (unlikely), we will top out at 65k deaths around 2 weeks from now.
PJYoung
How long do you want to ignore this user?
AG
PJYoung
How long do you want to ignore this user?
AG
PJYoung
How long do you want to ignore this user?
AG
ham98 said:

bmet said:

Nice data for Texas from TAMU CC. Multiple tabs/charts where you can break things down to county-by-county basis, etc:
https://tamucc.maps.arcgis.com/apps/opsdashboard/index.html#/7b82e7fc0e2142cf9a07aa9f7ce5b87f


cool

This national map is somehow more up to date - by county.

https://covidcompare.com/
Pasquale Liucci
How long do you want to ignore this user?
AG
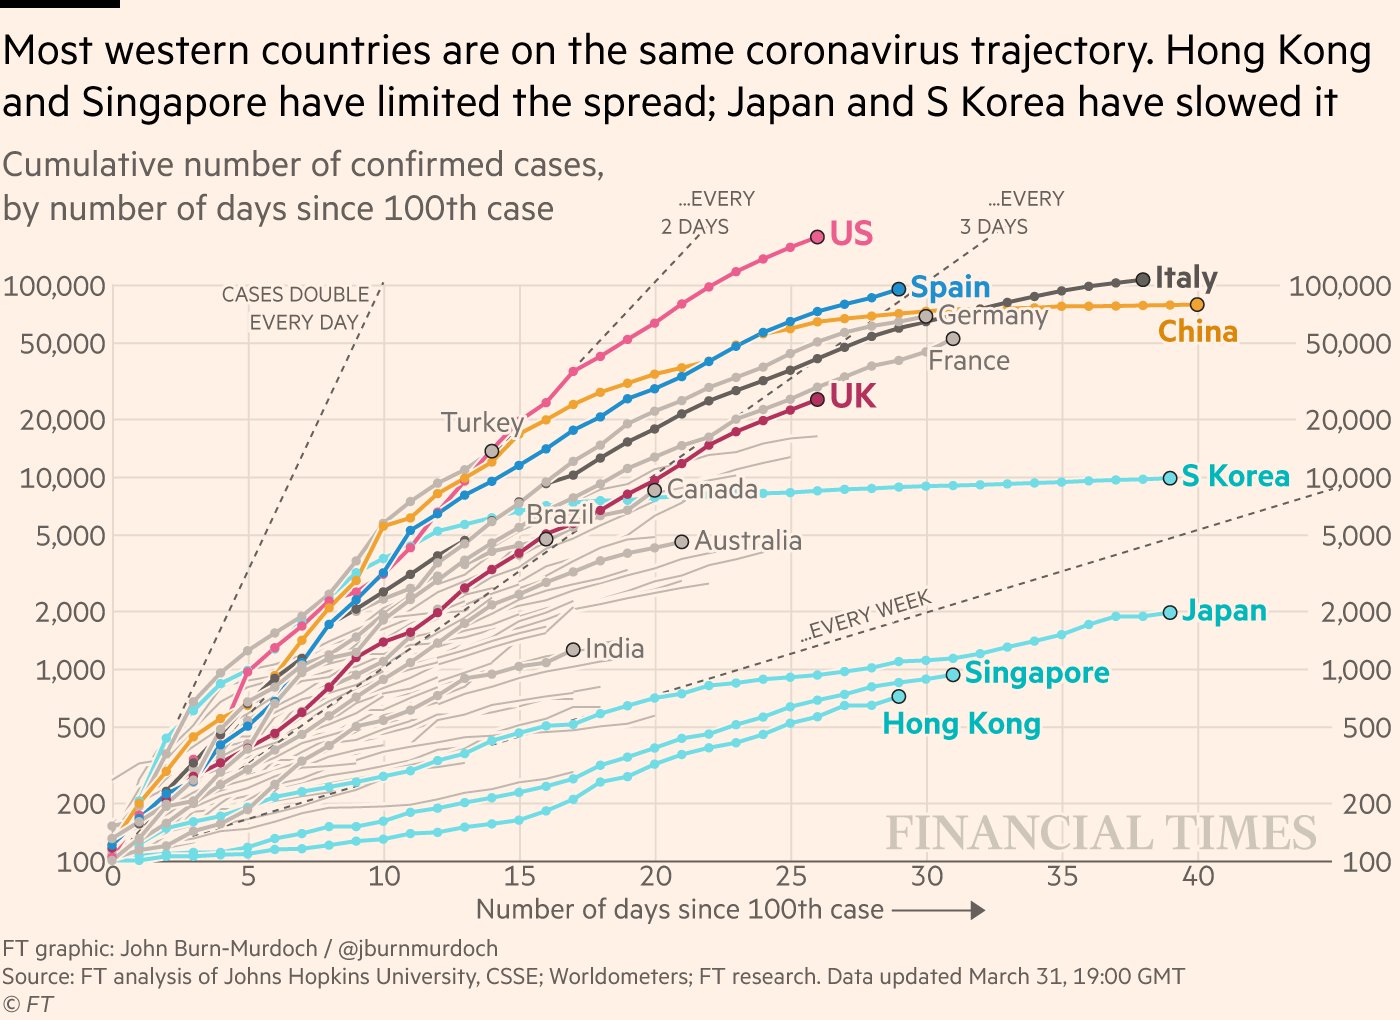
How is the USA doubling line accurate? We are not doubling every 2-3 days.

Seven Costanza
How long do you want to ignore this user?
AG
The current curve of the US in that graph looks like it's doubling about every 5 days over the past week or so.
PJYoung
How long do you want to ignore this user?
AG
PJYoung
How long do you want to ignore this user?
AG
Lester Freamon said:

How is the USA doubling line accurate? We are not doubling every 2-3 days.


Yeah right now it's between 4 and 5 days for sure.
buda91
How long do you want to ignore this user?
AG
Somethings glitchy there's no cases listed for Harris county
PJYoung
How long do you want to ignore this user?
AG
buda91 said:

Somethings glitchy there's no cases listed for Harris county

For some weird reason Harris County and the City of Houston are keeping separate numbers. They were at 563 combined yesterday
BANA89
How long do you want to ignore this user?
AG
Anyone else notice that line down I35 plus the big border towns? That's ominous...

A friend works for a company with a manufacturing plant in Mexico that says they have huge numbers of infected and the Mexican government isn't doing a lot of testing or tracking cases. They're numbers could exceed NY's and might lead back up here even if only truckers...
buda91
How long do you want to ignore this user?
AG
PJYoung said:

buda91 said:

Somethings glitchy there's no cases listed for Harris county

For some weird reason Harris County and the City of Houston are keeping separate numbers. They were at 563 combined yesterday


Can you tell if the Texas total includes either houston or Harris county?
PJYoung
How long do you want to ignore this user?
AG
buda91 said:

PJYoung said:

buda91 said:

Somethings glitchy there's no cases listed for Harris county

For some weird reason Harris County and the City of Houston are keeping separate numbers. They were at 563 combined yesterday


Can you tell if the Texas total includes either houston or Harris county?

I'm guessing the Texas total would be off by the Harris County glitch.

Texas is at 3,716 today on Worldometer, covidcompare has Texas at 3,919.

That's the state view on covidcompare. In the county view they have Texas at 3,239. I am guessing the 680 case difference is Harris County. Weird. Ah yeah I just confirmed it with this:

Quote:

On Wednesday April 1, Harris County confirmed 303 coronavirus cases, with two deaths and 61 recoveries.

The City of Houston now has at least four deaths. The city has 377 confirmed cases.

I'm sure they'll fix it eventually. They have the correct numbers for Texas, including Harris County, in the state view but not the county view.
PJYoung
How long do you want to ignore this user?
AG
BlackGoldAg2011 said:

Here is a graph i have been keeping, to track the changing CFR for each country above 5k cases. i'll update this post as i update my graphs. Data from https://www.worldometers.info/coronavirus/


Data updated 0 GMT 3/27/2020

my interesting observations:
3/19/2020:
  • China and S. Korea are the only two that have exited exponential growth so should be settling in on their final numbers. looks like 4% for china and 1%-1.5% for S. Korea (who still has 76% of its cases as active)
  • The US is the only country in exponential growth with a declining CFR (since it was asked, CFR is Case Fatality rate, or simply the number of deaths divided by the number of cases). This could possibly be in part due to the fact that our early data skewed high due to the first tracked outbreak being in a nursing home. It looks like our final number and S. Korea's might meet.
  • Germany's number is a confusing anomaly. They are about 1 day ahead of us on the daily total case curve. Have almost no deaths. One possible explanation is that maybe their outbreak started in younger communities. I'm very interested to watch their number as they only really started having deaths a few days ago (3/15/2020)
3/23/2020:
  • Two more countries have joined the 5k+ but i haven't added them yet (UK and Switzerland). I'll add them once they pass S. Korea.
  • I added a CFR plot based on days past the 100th case to get a better look at how the countries compare to each other, not just where they are today. From that it looks like about 3 basic groupings with the upper tier (Italy, Iran, and Spain) looking like things are going to be really rough for them over the coming month. i think i read that for those cases ending in death, the average time to death after exposure was 17.5 days
  • With S. Korea down to only 66% active cases, I'm feeling pretty good about my original prediction
  • USA has zero separation between the active and total cases line but the CFR curve seems to be bottoming out. This would lead me to believe that we should expect our CFR to start climbing again sometime over the next week. Based on our volume of cases and looking at the shape of S. Korea's curve, i'm going to predict we settle in the 2%-2.25% range but that is a very loose guess at this point with a lot of variables still shaking out
  • Finally I added a new plot showing total cases vs days since the 100th case on a semi-log plot. I did this because adding new data this morning it seemed like a lot of countries had begun to see a drop in new cases. This plot confirms that. We will see if it holds true this week or was just a data lag due to the weekend, but with the exception of one, every country on my list has fallen off exponential growth. (for those unfamiliar, on a semi-log plot, exponential growth is a straight line)
  • Which brings me to my final observation of the morning. The USA. Based on the latest data update, we are still solidly exponential at a rate of 10x increase every 8 days. This is with widespread testing only just now rolling out, so i wouldn't expect to start see effects from that for another day or two. At this rate we will have surpassed China (their reported numbers at least) by my Thursday update, and broken 100k by Friday. I realize there are a lot of factors here, but this trend cause me to really hope our efforts as a country towards the end of this last week prove to be enough to start bending our curve down soon.
3/24/2020:
  • Switzerland passed S. Korea so got added to my list
  • Italy is seeing some real separation between their total and active cases curves so I added a detailed look for them. Hopefully this means their CFR will stop going up shortly and maybe even come back down a bit over the next few weeks
  • USA is starting to show a bit of separation between total and active curves, and consequently, with yesterday's data saw an increase in CFR for the first time 3/3/20
3/25/2020:
  • Unfortunately it looks like S. Korea's CFR rise has been accelerating a bit over the last few days. Not a good trend
  • Looks like USA's CFR has indeed started to bend back upwards.
3/27/2020:
  • UK passed S. Korea so they got added to the list
  • Had to adjust the CFR scale for Italy, really hope they bend that down very soon...
  • Also corrected two "mistakes" on the normalized time graph. I was off one day on where i started S.Korea (started them at 200 cases instead of 100). China was starting at 500 cases due to when data tracking began, so i estimated where there 100th case day should have been and shifted them forward to start on day 4 which lines them up with the fastest growing other country to 500 cases. This may have some inaccuracies but should be the fairest comparison (all might be garbage anyways depending on your view of the data out of china.)
  • Added a stand alone USA graph showing the exponential growth curve for the whole time as well as what it is over the last 7 days to show how our growth is or isn't changing.


Can you update these?
BlackGoldAg2011
How long do you want to ignore this user?
AG
BlackGoldAg2011 said:

Here is a graph i have been keeping, to track the changing CFR for each country above 5k cases. i'll update this post as i update my graphs. Data from https://www.worldometers.info/coronavirus/


Data updated 0 GMT 4/1/2020

my interesting observations:
3/19/2020:
  • China and S. Korea are the only two that have exited exponential growth so should be settling in on their final numbers. looks like 4% for china and 1%-1.5% for S. Korea (who still has 76% of its cases as active)
  • The US is the only country in exponential growth with a declining CFR (since it was asked, CFR is Case Fatality rate, or simply the number of deaths divided by the number of cases). This could possibly be in part due to the fact that our early data skewed high due to the first tracked outbreak being in a nursing home. It looks like our final number and S. Korea's might meet.
  • Germany's number is a confusing anomaly. They are about 1 day ahead of us on the daily total case curve. Have almost no deaths. One possible explanation is that maybe their outbreak started in younger communities. I'm very interested to watch their number as they only really started having deaths a few days ago (3/15/2020)
3/23/2020:
  • Two more countries have joined the 5k+ but i haven't added them yet (UK and Switzerland). I'll add them once they pass S. Korea.
  • I added a CFR plot based on days past the 100th case to get a better look at how the countries compare to each other, not just where they are today. From that it looks like about 3 basic groupings with the upper tier (Italy, Iran, and Spain) looking like things are going to be really rough for them over the coming month. i think i read that for those cases ending in death, the average time to death after exposure was 17.5 days
  • With S. Korea down to only 66% active cases, I'm feeling pretty good about my original prediction
  • USA has zero separation between the active and total cases line but the CFR curve seems to be bottoming out. This would lead me to believe that we should expect our CFR to start climbing again sometime over the next week. Based on our volume of cases and looking at the shape of S. Korea's curve, i'm going to predict we settle in the 2%-2.25% range but that is a very loose guess at this point with a lot of variables still shaking out
  • Finally I added a new plot showing total cases vs days since the 100th case on a semi-log plot. I did this because adding new data this morning it seemed like a lot of countries had begun to see a drop in new cases. This plot confirms that. We will see if it holds true this week or was just a data lag due to the weekend, but with the exception of one, every country on my list has fallen off exponential growth. (for those unfamiliar, on a semi-log plot, exponential growth is a straight line)
  • Which brings me to my final observation of the morning. The USA. Based on the latest data update, we are still solidly exponential at a rate of 10x increase every 8 days. This is with widespread testing only just now rolling out, so i wouldn't expect to start see effects from that for another day or two. At this rate we will have surpassed China (their reported numbers at least) by my Thursday update, and broken 100k by Friday. I realize there are a lot of factors here, but this trend cause me to really hope our efforts as a country towards the end of this last week prove to be enough to start bending our curve down soon.
3/24/2020:
  • Switzerland passed S. Korea so got added to my list
  • Italy is seeing some real separation between their total and active cases curves so I added a detailed look for them. Hopefully this means their CFR will stop going up shortly and maybe even come back down a bit over the next few weeks
  • USA is starting to show a bit of separation between total and active curves, and consequently, with yesterday's data saw an increase in CFR for the first time 3/3/20
3/25/2020:
  • Unfortunately it looks like S. Korea's CFR rise has been accelerating a bit over the last few days. Not a good trend
  • Looks like USA's CFR has indeed started to bend back upwards.
3/27/2020:
  • UK passed S. Korea so they got added to the list
  • Had to adjust the CFR scale for Italy, really hope they bend that down very soon...
  • Also corrected two "mistakes" on the normalized time graph. I was off one day on where i started S.Korea (started them at 200 cases instead of 100). China was starting at 500 cases due to when data tracking began, so i estimated where there 100th case day should have been and shifted them forward to start on day 4 which lines them up with the fastest growing other country to 500 cases. This may have some inaccuracies but should be the fairest comparison (all might be garbage anyways depending on your view of the data out of china.)
  • Added a stand alone USA graph showing the exponential growth curve for the whole time as well as what it is over the last 7 days to show how our growth is or isn't changing.
4/1/2020
  • US new case growth has definitively fallen off of an exponential trend and for the last 10 days fits a 2nd order polynomial nearly perfectly. whether this is a true slow in case growth or just a slow in the growth of new confirmed cases is yet to be seen.
  • had to adjust the CFR scale for Italy again

updated
Philip J Fry
How long do you want to ignore this user?
AG
Infection data:


Deaths


Hospitalization Data


Positive/Negative/Pending Tests


CFR

Note: I'm using the following to calculate CFR: Today's Number Deaths/# Confirmed Infections 7 Days ago


VaultingChemist
How long do you want to ignore this user?
AG
I found these graphs for the 1918 Spanish Flu to be instructive.


AgLiving06
How long do you want to ignore this user?
Some "good" news for perspective.

We had 1,049 deaths yesterday per worldometers, but that's still a slowing of the increase (26% vs prior day increase of 29%).

The "Life to Date" average increase has been pretty stable and consistent at 24-25%.

The encouraging thing is that the 7 day average is at 25.8% and has been fallen steadily over the last 5 days.

This seems to signal the death rate really does seem to be slowing down.
JB!98
How long do you want to ignore this user?
AG
I have a question about the recovered and how they are counted. I understand that number may be small right now, but is that deducted from the total cases? Put another way, is the total case number the active number? Seeing the recovered number may prove a trend also.
Marcus Aurelius
How long do you want to ignore this user?
AG
Russia. Does anyone believe their reporting ? if true only covid is in Moscow?
Tony Franklins Other Shoe
How long do you want to ignore this user?
AG
Marcus Aurelius said:

Russia. Does anyone believe their reporting ? if true only covid is in Moscow?
Yeah, given what every other country that you could semi trust reported numbers, pretty sure those wouldn't be accurate.
AgLiving06
How long do you want to ignore this user?
JB!98 said:

I have a question about the recovered and how they are counted. I understand that number may be small right now, but is that deducted from the total cases? Put another way, is the total case number the active number? Seeing the recovered number may prove a trend also.

I think the problem is active cases is under represented. I believe the criteria is that you have to have 1 or 2 negative tests to be declared "recovered."

Think of all the people who test positive and then self quarantine for 14 days and go about their life. None of those get counted against the recovery rate.
HotardAg07
How long do you want to ignore this user?
AG
I'm losing my minid on the testing data. I'll save my time making a nice graph but this is the last 8 days of daily test results:

100989
104117
113503
95647
109071
107295
97806

It seems like we have hit a plateau and that is super dissappointing. Before this, we were increasing our daily testing capacity 5,000-10,000 tests per day. What is going on?
HotardAg07
How long do you want to ignore this user?
AG
Additionally, worth noting that we have 1,000,000 confirmed cases worldwide.

Yes yes, the real number is much higher than that, but still it's a milestone.
goodAg80
How long do you want to ignore this user?
AG
Numbers per million

PJYoung
How long do you want to ignore this user?
AG
HotardAg07 said:

I'm losing my minid on the testing data. I'll save my time making a nice graph but this is the last 8 days of daily test results:

100989
104117
113503
95647
109071
107295
97806

It seems like we have hit a plateau and that is super dissappointing. Before this, we were increasing our daily testing capacity 5,000-10,000 tests per day. What is going on?

Bumping up against lab limits.

California had a 60k lab backlog as of yesterday.

They averaged 2k tests a day in the past week.
PJYoung
How long do you want to ignore this user?
AG
PJYoung
How long do you want to ignore this user?
AG
ETFan
How long do you want to ignore this user?
BlackGoldAg2011 said:

BlackGoldAg2011 said:

4/1/2020
  • US new case growth has definitively fallen off of an exponential trend and for the last 10 days fits a 2nd order polynomial nearly perfectly. whether this is a true slow in case growth or just a slow in the growth of new confirmed cases is yet to be seen.
  • had to adjust the CFR scale for Italy again

updated

Am I thinking about this incorrectly or is this just simply because we've plateaued at only being able to test ~100k a day for the last 7+ days?
longeryak
How long do you want to ignore this user?
Stupe said:

All of this happening because China didn't want to admit that they had an issue.
Compounded by our leaders refusing to acknowledge it early on.
BlackGoldAg2011
How long do you want to ignore this user?
AG
ETFan said:

BlackGoldAg2011 said:

BlackGoldAg2011 said:

4/1/2020
  • US new case growth has definitively fallen off of an exponential trend and for the last 10 days fits a 2nd order polynomial nearly perfectly. whether this is a true slow in case growth or just a slow in the growth of new confirmed cases is yet to be seen.
  • had to adjust the CFR scale for Italy again

updated

Am I thinking about this incorrectly or is this just simply because we've plateaued at only being able to test ~100k a day for the last 7+ days?

That's what I meant by my second sentence. Real case growth=actual people with infections, confirmed cases=number of positive tests. Until we are unbound on our testing limits it's tough to know for sure which of the two is causing the bend.
Premium
How long do you want to ignore this user?
AG
PJYoung said:


This is worthless
HotardAg07
How long do you want to ignore this user?
AG
Agreed, I think this one is pretty good:

Shows how low the traffic is in Wuhan still, NYC, Paris compared to normal during the lockout.

The creator of the graphs is arguing that this is also evidence that London is locking down less than other major cities in the middle of an outbreak.
 
×
subscribe Verify your student status
See Subscription Benefits
Trial only available to users who have never subscribed or participated in a previous trial.