


Something like this?
Hospitalization data is a better short term proxy but we're not getting enough of this data. Death's are very informative as well but the main issue with that data is the extreme lag time of up to a month. Deaths today tell you about the infection status several weeks to a month in the past.Philip J Fry said:
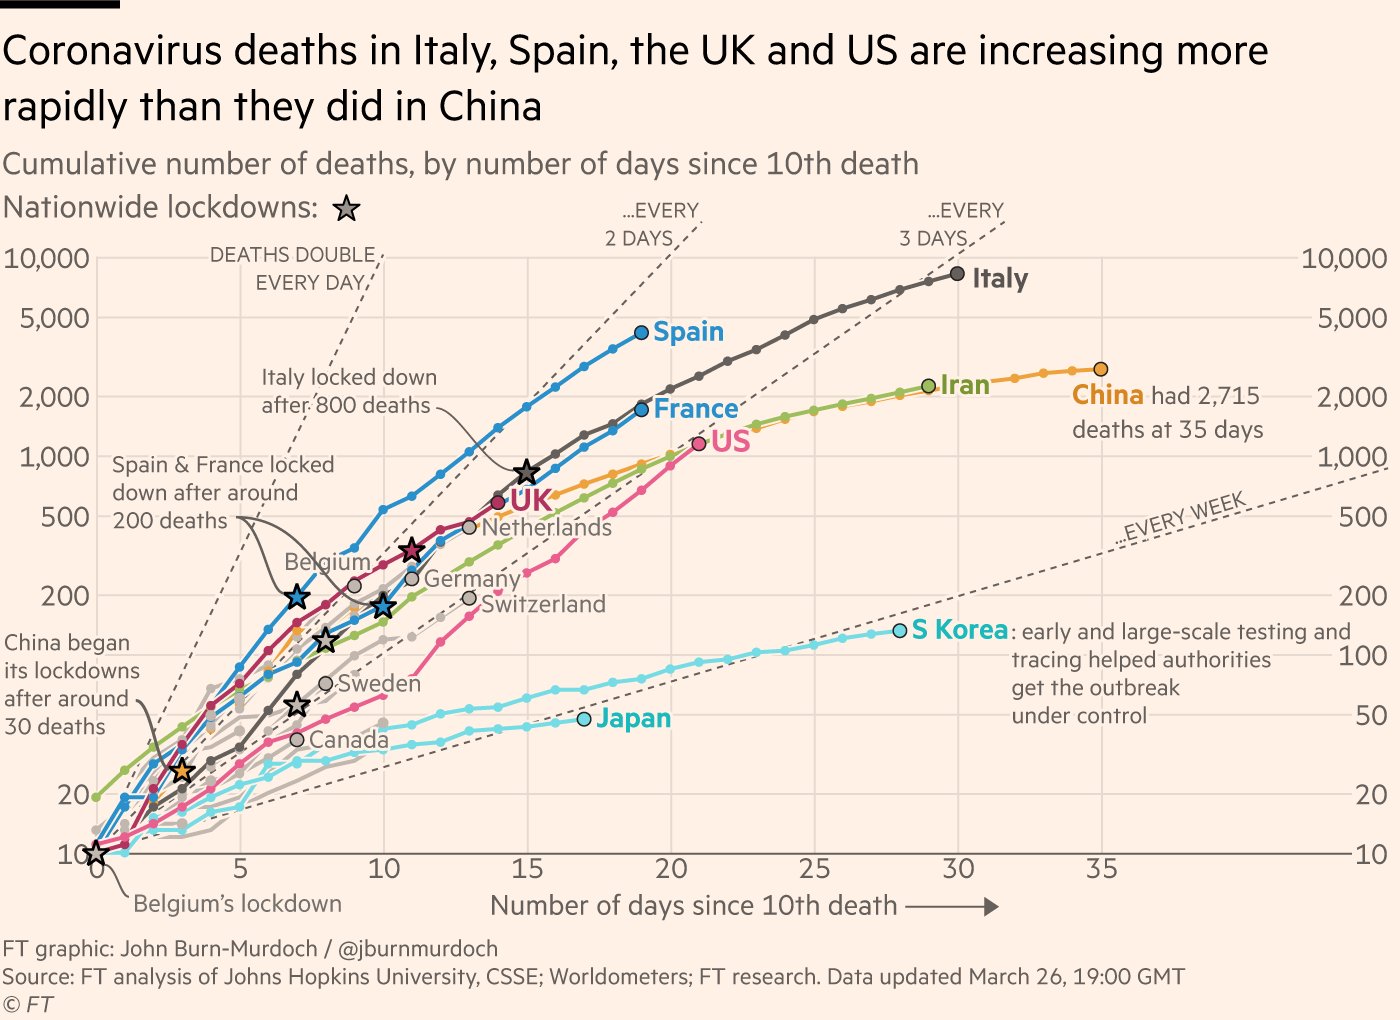
I show the infected thread, but the one I care about really is the death curve. I think it tells us more about the true situation we're in. I cannot imagine what NY is about to go throw in the next weeks off this holds. It's got to start bending soon.
updated and added a new plotBlackGoldAg2011 said:
Here is a graph i have been keeping, to track the changing CFR for each country above 5k cases. i'll update this post as i update my graphs. Data from https://www.worldometers.info/coronavirus/
Data updated 0 GMT 3/27/2020
my interesting observations:
3/19/2020:3/23/2020:
- China and S. Korea are the only two that have exited exponential growth so should be settling in on their final numbers. looks like 4% for china and 1%-1.5% for S. Korea (who still has 76% of its cases as active)
- The US is the only country in exponential growth with a declining CFR (since it was asked, CFR is Case Fatality rate, or simply the number of deaths divided by the number of cases). This could possibly be in part due to the fact that our early data skewed high due to the first tracked outbreak being in a nursing home. It looks like our final number and S. Korea's might meet.
- Germany's number is a confusing anomaly. They are about 1 day ahead of us on the daily total case curve. Have almost no deaths. One possible explanation is that maybe their outbreak started in younger communities. I'm very interested to watch their number as they only really started having deaths a few days ago (3/15/2020)
3/24/2020:
- Two more countries have joined the 5k+ but i haven't added them yet (UK and Switzerland). I'll add them once they pass S. Korea.
- I added a CFR plot based on days past the 100th case to get a better look at how the countries compare to each other, not just where they are today. From that it looks like about 3 basic groupings with the upper tier (Italy, Iran, and Spain) looking like things are going to be really rough for them over the coming month. i think i read that for those cases ending in death, the average time to death after exposure was 17.5 days
- With S. Korea down to only 66% active cases, I'm feeling pretty good about my original prediction
- USA has zero separation between the active and total cases line but the CFR curve seems to be bottoming out. This would lead me to believe that we should expect our CFR to start climbing again sometime over the next week. Based on our volume of cases and looking at the shape of S. Korea's curve, i'm going to predict we settle in the 2%-2.25% range but that is a very loose guess at this point with a lot of variables still shaking out
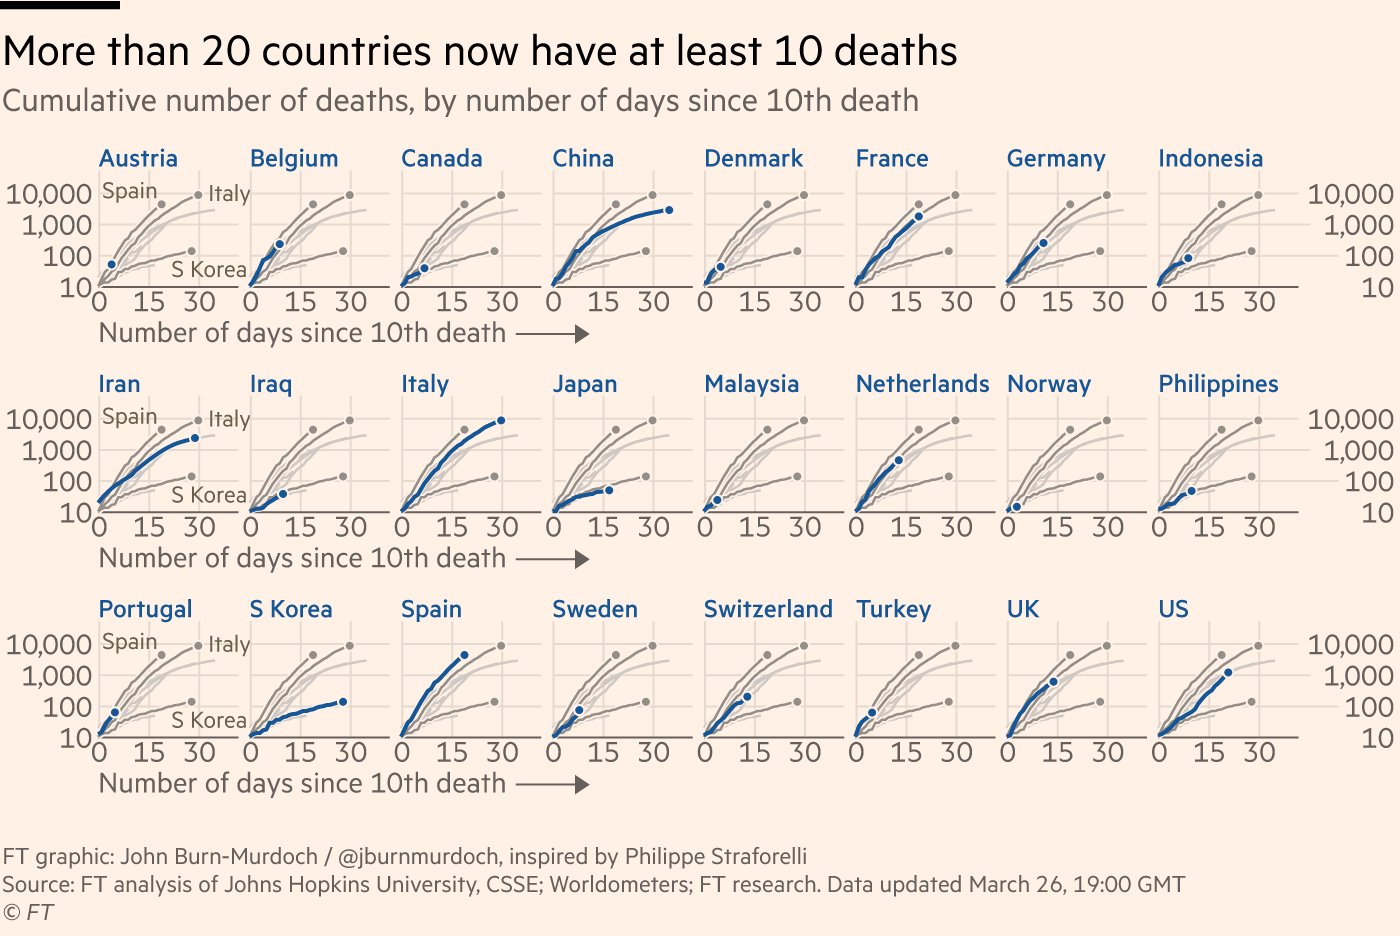
- Finally I added a new plot showing total cases vs days since the 100th case on a semi-log plot. I did this because adding new data this morning it seemed like a lot of countries had begun to see a drop in new cases. This plot confirms that. We will see if it holds true this week or was just a data lag due to the weekend, but with the exception of one, every country on my list has fallen off exponential growth. (for those unfamiliar, on a semi-log plot, exponential growth is a straight line)
- Which brings me to my final observation of the morning. The USA. Based on the latest data update, we are still solidly exponential at a rate of 10x increase every 8 days. This is with widespread testing only just now rolling out, so i wouldn't expect to start see effects from that for another day or two. At this rate we will have surpassed China (their reported numbers at least) by my Thursday update, and broken 100k by Friday. I realize there are a lot of factors here, but this trend cause me to really hope our efforts as a country towards the end of this last week prove to be enough to start bending our curve down soon.
3/25/2020:
- Switzerland passed S. Korea so got added to my list
- Italy is seeing some real separation between their total and active cases curves so I added a detailed look for them. Hopefully this means their CFR will stop going up shortly and maybe even come back down a bit over the next few weeks
- USA is starting to show a bit of separation between total and active curves, and consequently, with yesterday's data saw an increase in CFR for the first time 3/3/20
3/27/2020:
- Unfortunately it looks like S. Korea's CFR rise has been accelerating a bit over the last few days. Not a good trend
- Looks like USA's CFR has indeed started to bend back upwards.
- UK passed S. Korea so they got added to the list
- Had to adjust the CFR scale for Italy, really hope they bend that down very soon...
- Also corrected two "mistakes" on the normalized time graph. I was off one day on where i started S.Korea (started them at 200 cases instead of 100). China was starting at 500 cases due to when data tracking began, so i estimated where there 100th case day should have been and shifted them forward to start on day 4 which lines them up with the fastest growing other country to 500 cases. This may have some inaccuracies but should be the fairest comparison (all might be garbage anyways depending on your view of the data out of china.)
- Added a stand alone USA graph showing the exponential growth curve for the whole time as well as what it is over the last 7 days to show how our growth is or isn't changing.


proudaggie02 said:
I was following everything closely for a while, but I have not kept up the last few days. Has anyone added a "US less NY State" metric to the graphs?
I looked at daily new cases and daily new cases per 1,000,000 for USA, USA less NY State, NY State, and Italy. It helped put things in perspective for me, and I'm wondering if others are charting the USA outside of the major hotspot? It looks like NY and NJ have accounted for 55%+ of the USA cases for several days.


lol Japan suddenly back on the exponential growth train now that the Olympics have been postponed.RangerRick9211 said:
Interesting way to visualize when a country bails off exponential growth: https://aatishb.com/covidtrends/.
Probably has more to do with the fact that schools have reopened after being closed for a month and many businesses relaxed their WFH requirements.PJYoung said:lol Japan suddenly back on the exponential growth train now that the Olympics have been postponed.RangerRick9211 said:
Interesting way to visualize when a country bails off exponential growth: https://aatishb.com/covidtrends/.


You could also say that Italy has flattened the rise in daily cases and has therefore flattened their attack rate finally.PJYoung said:
You could say Italy has a 10 day peak and still going. Not great news for New York.
AvidAggie said:
Would really like to see the Italy numbers start to go down
Infection rates have stabilized but not yet decreasing. Deaths are still increasing - especially in last two days. I'd not give that a thumbs up just yet. Here's hoping to see falling numbers.KidDoc said:You could also say that Italy has flattened the rise in daily cases and has therefore flattened their attack rate finally.PJYoung said:
You could say Italy has a 10 day peak and still going. Not great news for New York.
The drop off exponential increase in infection rates IS a victory. A small one but a victory. The death rates will follow a stabilization or lowering of death rates. It is good news just not great news.Old RV Ag said:Infection rates have stabilized but not yet decreasing. Deaths are still increasing - especially in last two days. I'd not give that a thumbs up just yet. Here's hoping to see falling numbers.KidDoc said:You could also say that Italy has flattened the rise in daily cases and has therefore flattened their attack rate finally.PJYoung said:
You could say Italy has a 10 day peak and still going. Not great news for New York.
KidDoc said:The drop off exponential increase in infection rates IS a victory. A small one but a victory. The death rates will follow a stabilization or lowering of death rates. It is good news just not great news.Old RV Ag said:Infection rates have stabilized but not yet decreasing. Deaths are still increasing - especially in last two days. I'd not give that a thumbs up just yet. Here's hoping to see falling numbers.KidDoc said:You could also say that Italy has flattened the rise in daily cases and has therefore flattened their attack rate finally.PJYoung said:
You could say Italy has a 10 day peak and still going. Not great news for New York.
Deaths are a lagging indicator. Those people who died today got sick 10-21 days ago... back when new cases were rising exponentially.Old RV Ag said:Infection rates have stabilized but not yet decreasing. Deaths are still increasing - especially in last two days. I'd not give that a thumbs up just yet. Here's hoping to see falling numbers.KidDoc said:You could also say that Italy has flattened the rise in daily cases and has therefore flattened their attack rate finally.PJYoung said:
You could say Italy has a 10 day peak and still going. Not great news for New York.
Yes, I understand that. But, accordingly, then death rates will continue still to increase. And until the infection rates actually decrease then death rates will increase and at best stabilize. Infection rates stabilization is good to see but until actual decrease is seen the system will continue to be overloaded more as patients don't roll out at the same rate they are rolling in due to the long incubation and recovery time. And until decrease is seen, it can always have been a pause before the next surge. Again, here's hoping to see falling numbers.Mordred said:Deaths are a lagging indicator. Those people who died today got sick 10-21 days ago... back when new cases were rising exponentially.Old RV Ag said:Infection rates have stabilized but not yet decreasing. Deaths are still increasing - especially in last two days. I'd not give that a thumbs up just yet. Here's hoping to see falling numbers.KidDoc said:You could also say that Italy has flattened the rise in daily cases and has therefore flattened their attack rate finally.PJYoung said:
You could say Italy has a 10 day peak and still going. Not great news for New York.


