
There are a lot of resources now showing cases AND hospitalization rising in Texas, but to be in perfect context it is rising but still well under ICU capacity.
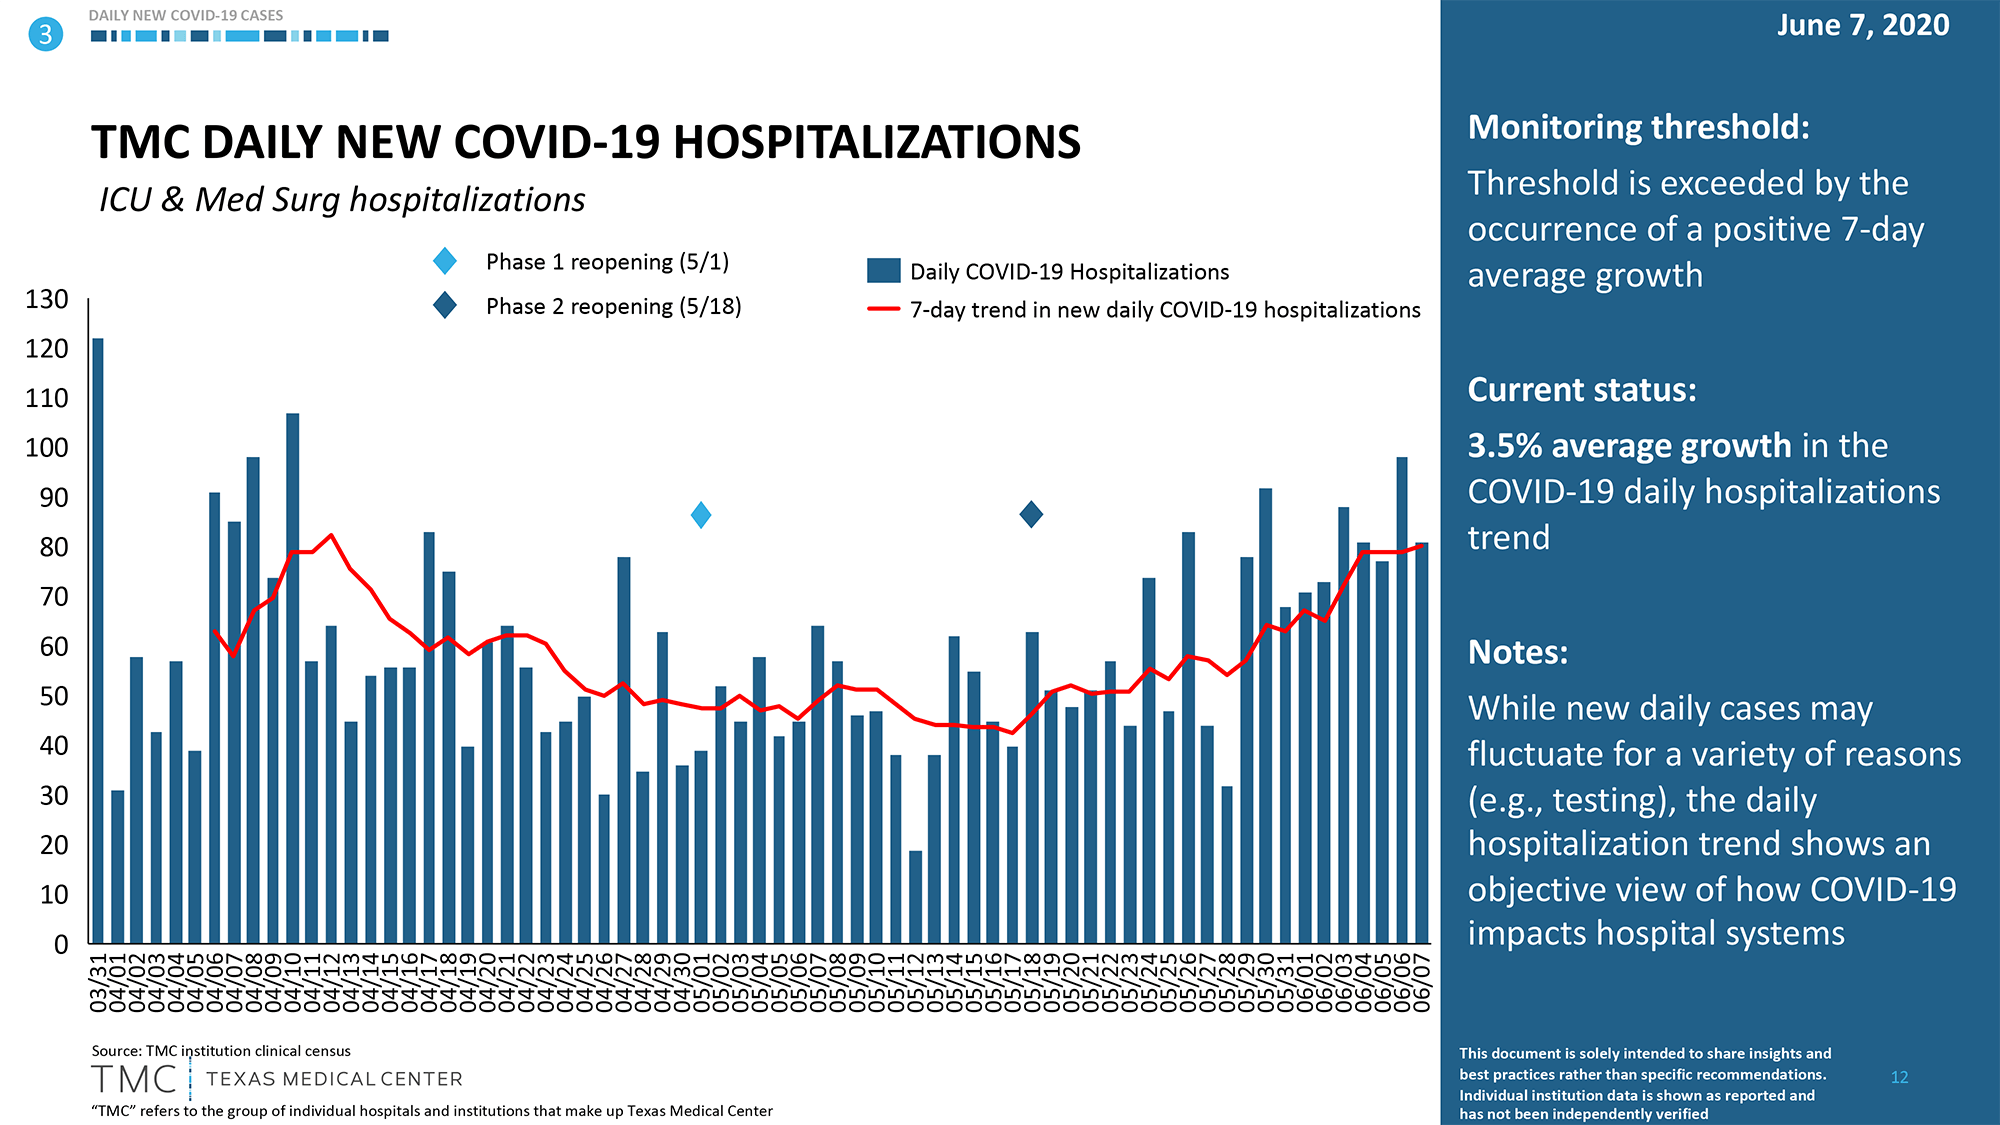
Here is the data from TMC, clearly showing hospitalizations rising in Houston
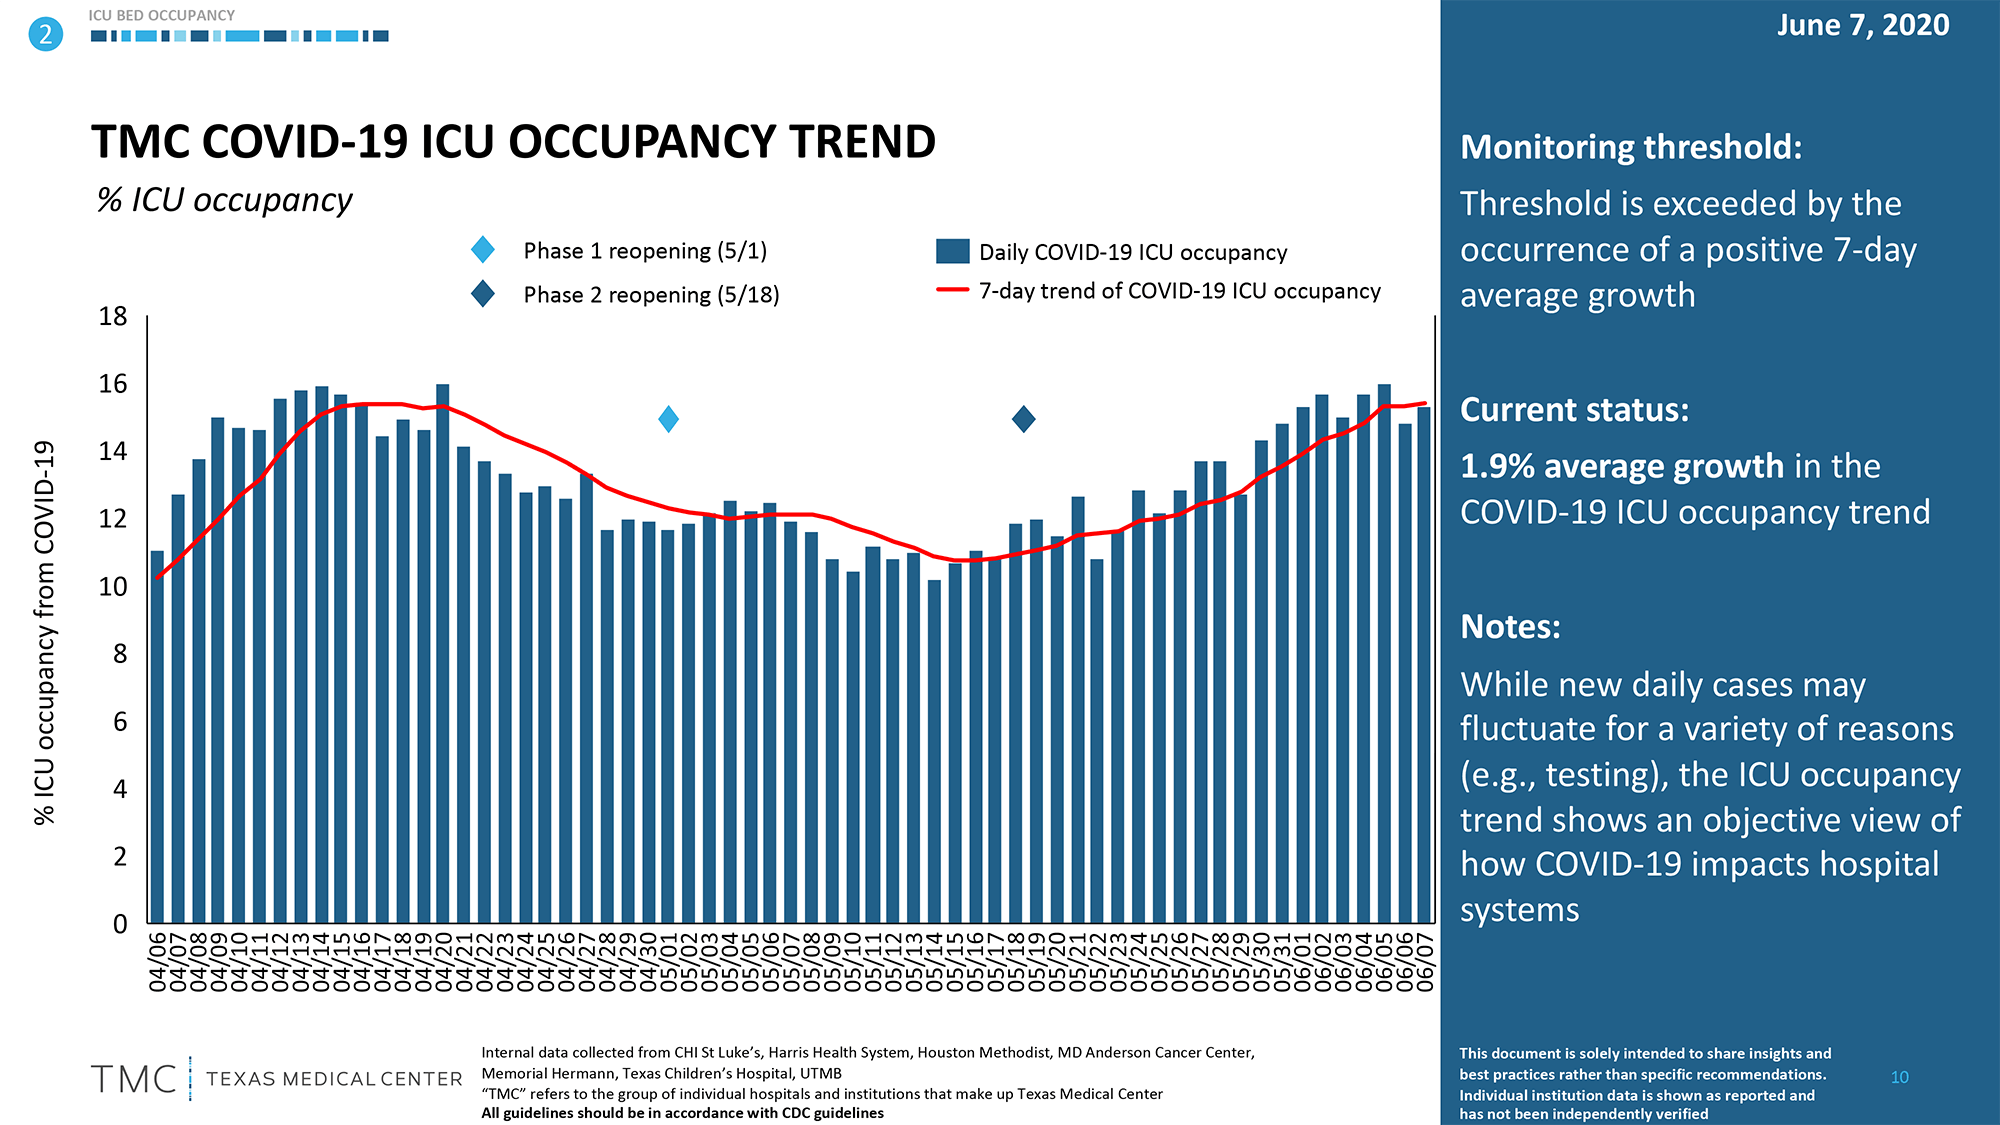
But, as you can see, Houston is still below "normal" ICU levels:

Hopefully the trend doesn't continue.
Here is the data from TMC, clearly showing hospitalizations rising in Houston
But, as you can see, Houston is still below "normal" ICU levels:
Hopefully the trend doesn't continue.


