
Case Fatality Rate
Daily Charts
622,410 Views |
2786 Replies |
Last: 2 yr ago by AggieUSMC
Updated. and quoted since i added some new plots and observations.BlackGoldAg2011 said:
Here is a graph i have been keeping, to track the changing CFR for each country above 5k cases. i'll update this post as i update my graphs. Data from https://www.worldometers.info/coronavirus/
Data updated 0 GMT 3/23/2020
my interesting observations:
3/19/2020:3/23/2020:
- China and S. Korea are the only two that have exited exponential growth so should be settling in on their final numbers. looks like 4% for china and 1%-1.5% for S. Korea (who still has 76% of its cases as active)
- The US is the only country in exponential growth with a declining CFR (since it was asked, CFR is Case Fatality rate, or simply the number of deaths divided by the number of cases). This could possibly be in part due to the fact that our early data skewed high due to the first tracked outbreak being in a nursing home. It looks like our final number and S. Korea's might meet.
- Germany's number is a confusing anomaly. They are about 1 day ahead of us on the daily total case curve. Have almost no deaths. One possible explanation is that maybe their outbreak started in younger communities. I'm very interested to watch their number as they only really started having deaths a few days ago (3/15/2020)
- Two more countries have joined the 5k+ but i haven't added them yet (UK and Switzerland). I'll add them once they pass S. Korea.
- I added a CFR plot based on days past the 100th case to get a better look at how the countries compare to each other, not just where they are today. From that it looks like about 3 basic groupings with the upper tier (Italy, Iran, and Spain) looking like things are going to be really rough for them over the coming month. i think i read that for those cases ending in death, the average time to death after exposure was 17.5 days
- With S. Korea down to only 66% active cases, I'm feeling pretty good about my original prediction
- USA has zero separation between the active and total cases line but the CFR curve seems to be bottoming out. This would lead me to believe that we should expect our CFR to start climbing again sometime over the next week. Based on our volume of cases and looking at the shape of S. Korea's curve, i'm going to predict we settle in the 2%-2.25% range but that is a very loose guess at this point with a lot of variables still shaking out
- Finally I added a new plot showing total cases vs days since the 100th case on a semi-log plot. I did this because adding new data this morning it seemed like a lot of countries had begun to see a drop in new cases. This plot confirms that. We will see if it holds true this week or was just a data lag due to the weekend, but with the exception of one, every country on my list has fallen off exponential growth. (for those unfamiliar, on a semi-log plot, exponential growth is a straight line)
- Which brings me to my final observation of the morning. The USA. Based on the latest data update, we are still solidly exponential at a rate of 10x increase every 8 days. This is with widespread testing only just now rolling out, so i wouldn't expect to start see effects from that for another day or two. At this rate we will have surpassed China (their reported numbers at least) by my Thursday update, and broken 100k by Friday. I realize there are a lot of factors here, but this trend cause me to really hope our efforts as a country towards the end of this last week prove to be enough to start bending our curve down soon.


I agree that we seem on pace to hit 100k by the end of the week, but i think the issue is that at some point we'll be limited by the number of tests/day we can process.
Not saying this is wrong, because the two things are in no way mutually exclusive, but I'm seeing reports that Germany's outbreak may very well have begun in a population that skewed young and healthy:Exsurge Domine said:BlackGoldAg2011 said:
Here is a graph i have been keeping, to track the changing CFR for each country above 5k cases. i'll update this post as i update my graphs. Data from https://www.worldometers.info/coronavirus/
Data updated 0 GMT 3/19/2020
my interesting observations:
3/19/2020:
- China and S. Korea are the only two that have exited exponential growth so should be settling in on their final numbers. looks like 4% for china and 1%-1.5% for S. Korea (who still has 76% of its cases as active)
- The US is the only country in exponential growth with a declining CFR. This could possibly be in part due to the fact that our early data skewed high due to the first tracked outbreak being in a nursing home. It looks like our final number and S. Korea's might meet.
- Germany's number is a confusing anomaly. They are about 1 day ahead of us on the daily total case curve. Have almost no deaths. On possible explanation is that maybe their outbreak started in younger communities. I'm very interested to watch their number as they only really started having deaths a few days ago (3/15/2020)
I saw a random high follower tweet post that they're using that hcq-azithromycin cocktail in at the very beginning

[url=https://www.forbes.com/sites/guymartin/2020/03/20/with-its-covid-19-caseload-spiking-to-14000-heres-why-germanys-mortality-rate-is-002-or-4000-times-lower-than-italys/#522db57877ad]Forbes Article[/url] updated 3/22
some excerpts:
Quote:
There is one major difference between Germany's Covid-19 demographic and that of the pan-European hot zone of Italy. The first is that the onslaught of Covid-19 arrived in the teeth of Europe's ski season, so that many Germans who initially contracted the virus did so in Italy, which is whyfor the moment70% of all reported cases in Germany remain among the young, or more broadly, among the not-elderly, between the ages of 20 and 50.
Quote:
According to German medical professionals, and no less a medical statistician than the President of the Robert Koch Institut, Lothar Wieler, on Friday morning, March 20, it was Germany's good fortune that Covid-19 simply began among the young.
I really think death rate will just be a function of the age distribution of the infected population.
US case fatality rate currently at 1.3% and likely to fall, per the CDC Director speaking to my hospital right now.
China numbers (which must be questioned) falling in around 4%, and unlikely to fall much more given the flat and declining case volumes. Wuhan today released their travel restrictions for those who have either recovered or had a negative test.
Italy currently at 9%, mostly sites to the fastest ramp up and overrun of hospitals and a very old population.
My prediction remains unchanged at 0.5% here in the US, and 1.5% worldwide.
can you provide some insight into what data the items I bolded are coming from? So far this thread has remained free of the bickering over course of action so i don't want to derail, but from a data perspective i am genuinely curious about these points. I am no epidemiologist but I do look at large data sets for a living. I don't see where these conclusion come from looking at the data, so I genuinely want to know if there is something I am missing. To specifically address each:FrioAg 00 said:
US case fatality rate currently at 1.3% and likely to fall, per the CDC Director speaking to my hospital right now.
China numbers (which must be questioned) falling in around 4%, and unlikely to fall much more given the flat and declining case volumes. Wuhan today released their travel restrictions for those who have either recovered or had a negative test.
Italy currently at 9%, mostly sites to the fastest ramp up and overrun of hospitals and a very old population.
My prediction remains unchanged at 0.5% here in the US, and 1.5% worldwide.
- US at 1.3% and likely to fall - Looking at the data for the two other countries that have allegedly gotten their outbreaks under control (China and S. Korea) both saw CFR fall during the exponential phase, but then it bottoms out and begins to rise again once there starts to be meaningful separation in the total and active case counts. The US CFR curve has begun to flatten out of its decline over the last several days, and so based on the only available data, I would expect it to start to climb again as more of our cases start to reach resolution if it does anything. I don't see any data that would support a renewed decline in CFR.
- I'm confused by your statement about China's CFR being unlikely to fall much more. China's CFR has been rising for the last 4 to 6 weeks, the phrasing in your statement insinuates that it is currently falling. Maybe this is just a miscommunication.
- Genuinely curious what you are basing your final CFR predictions on as this is substantially lower than any available case study type data would insinuate.
Again, I don't want to get into an argument, i just want to gather the best data possible. you can see the data I'm currently going off of all on my page one post that i'm updating daily.
Meeting with a director from the CDC here at my hospital in DC.
Any data presented as a ratio, such as a rate of hospitalization rate per confirmed case, or death per confirmed case - you have to make the distinction between the real cases in the population vs tested and confirmed cases in the population. You also have to look at a shorter cycle time resulting in Death from those considered "recovered".
For example, my workforce has about half a dozen confirmed cases and all are actually on the recovering side - haven't felt symptoms in days. But none have been clear long enough to be considered "recovered" or return to work.
As testing ramps up exponentially AND time passes for confirmed cases to hit "recovered" status, the denominator is going to outpace the numerator.
And that's even before any advancements in the actual treatment - like the malaria drugs which are showing promise
The flatten the curve objective also deals with much different realities in different places
For example, in the US our ICU beds per capita are 2x what Italy has, and the percent of our population over 65 is also 13% compared to 23%.
So per "high risk" person in our population, our resources are almost 400% higher
For example, in the US our ICU beds per capita are 2x what Italy has, and the percent of our population over 65 is also 13% compared to 23%.
So per "high risk" person in our population, our resources are almost 400% higher
Not to mention much less population densityFrioAg 00 said:
The flatten the curve objective also deals with much different realities in different places
For example, in the US our ICU beds per capita are 2x what Italy has, and the percent of our population over 65 is also 13% compared to 23%.
So per "high risk" person in our population, our resources are almost 400% higher
updated
- Switzerland passed S. Korea so got added to my list
- Italy is seeing some real separation between their total and active cases curves so I added a detailed look for them. Hopefully this means their CFR will stop going up shortly and maybe even come back down a bit over the next few weeks
- USA is starting to show a bit of separation between total and active curves, and consequently, with yesterday's data saw an increase in CFR for the first time 3/3/20
Just curious, what does CFR stand for?
case fatality rate (CFR)
like the graphs BlackGoldAg2011, THANKS

Thanks for updating your page one graphs errbody.
The guy who makes these added a new one today:
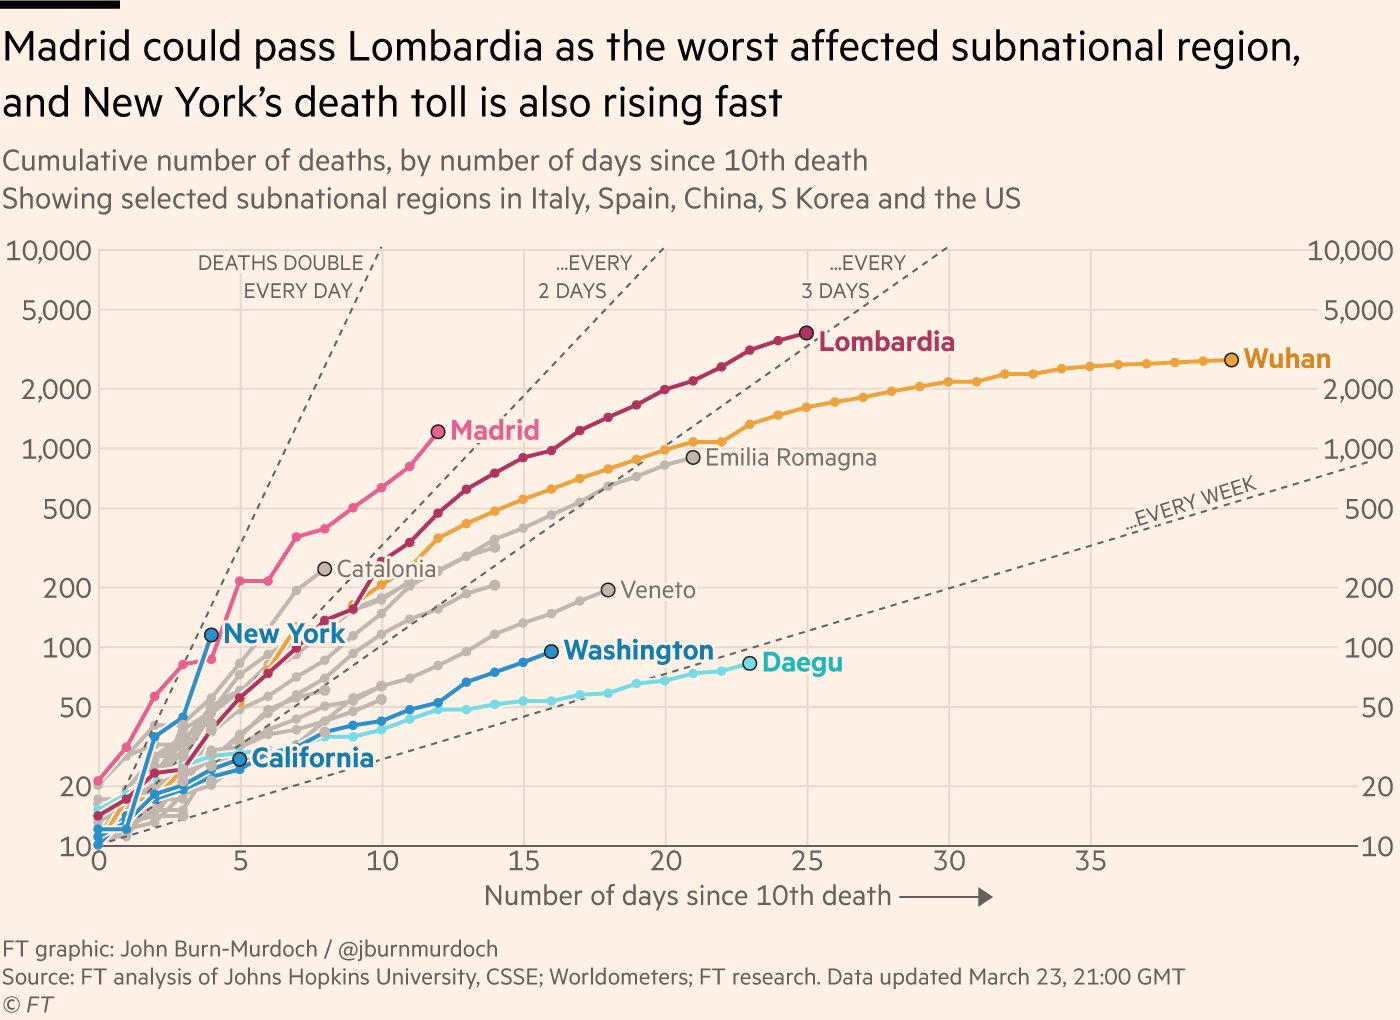
He also changed the way he displayed this graph, showing how fast deaths double by each line in the logarithmic graph:

He also changed the way he displayed this graph, showing how fast deaths double by each line in the logarithmic graph:
when you look at the lines on the graphs, up is bad, down is good.KlinkerAg11 said:
BlackGoldAg2011 said:when you look at the lines on the graphs, up is bad, down is good.KlinkerAg11 said:
Well apparently in the medicine community, negative means good. Which makes absolutely no sense. In the real world community, you- that would be chaos.
What I can tell from the charts is China and Iran are lying.
Looking at the plots, I'm not particularly impressed with the effects that lockdown is having. I get it might take more than 10 days to show major effects, but still. UK. was already trending towards a slowdown in deaths BEFORE lockdown,
Mike Shaw - Class of '03

NASAg03 said:
Looking at the plots, I'm not particularly impressed with the effects that lockdown is having. I get it might take more than 10 days to show major effects, but still. UK. was already trending towards a slowdown in deaths BEFORE lockdown,
4 days to get exposed, up to 7 more to get sick enough to seek treatment, up to SIX days to get test results back - usually quicker.
So 10 days is a decent lag time from exposure to showing up in these stats. In 10 days at an R0 of 2.5 means 1 person is responsible for the infection of almost 10,000 more. It's hard to wrap your mind around that.
So today Michigan jumped off the map for me.

Curious about the Netherlands. They're practicing herd immunity. I think is great thy someone is experimenting with it for future knowledge. I would have expected their cases to grow more, but they're actually down the last two days.
https://www.worldometers.info/coronavirus/country/netherlands/
https://www.worldometers.info/coronavirus/country/netherlands/
UK stated strategy to begin predicted it would rise faster, but ultimately flatten faster as well.
This would collectively minimize lives lost AND economic impact. So far the trend doesn't contradict their theory but the nest 2 weeks is going to the most telling
This would collectively minimize lives lost AND economic impact. So far the trend doesn't contradict their theory but the nest 2 weeks is going to the most telling
UK realized that strategy was flawed and changed course though, announcing their own lockdown.
In an ideal world, we would have completely isolated everything for 3 days to halt transmission, allowing all of the asymptomatic cases to burn out and die in their hosts, and then resumed life with an increased testing capability that would have allowed us to used targeted tracing of the few infected people left to root out the virus when it is at a lower and more manageable level. We probably still wouldn't have mass gatherings and travel would still be heavily restricted, but at least the situation would be manageable.
In an ideal world, we would have completely isolated everything for 3 days to halt transmission, allowing all of the asymptomatic cases to burn out and die in their hosts, and then resumed life with an increased testing capability that would have allowed us to used targeted tracing of the few infected people left to root out the virus when it is at a lower and more manageable level. We probably still wouldn't have mass gatherings and travel would still be heavily restricted, but at least the situation would be manageable.
Where does it say they are practicing herd immunity?davido said:
Curious about the Netherlands. They're practicing herd immunity. I think is great thy someone is experimenting with it for future knowledge. I would have expected their cases to grow more, but they're actually down the last two days.
https://www.worldometers.info/coronavirus/country/netherlands/
davido said:
Curious about the Netherlands. They're practicing herd immunity. I think is great thy someone is experimenting with it for future knowledge. I would have expected their cases to grow more, but they're actually down the last two days.
https://www.worldometers.info/coronavirus/country/netherlands/
Quote:
Rutte also mentioned the possibility of herd immunity, which was immediately met with backlash from experts who say deliberately exposing as many people to the virus to build an immune population is not a good idea.
Rutte quickly clarified that herd immunity would be a side effect of the country's approach and not the focus. However, infectious disease expert Natalie Dean says that the safest way we're likely to develop herd immunity against COVID-19 isn't naturally over time, but through a vaccine.
An infectious disease expert explains why herd immunity probably won't work in the fight against coronavirus
My friend in the UK has all the symptoms but cannot get tested since they do not know of any contact with someone who has it. About half the people that live around them have the same issue. Their numbers will skyrocket in the next few days.
P.U.T.U said:
My friend in the UK has all the symptoms but cannot get tested since they do not know of any contact with someone who has it. About half the people that live around them have the same issue. Their numbers will skyrocket in the next few days.
It's going to be a few weeks before we start testing everybody that should be tested in the United States. The much promised ramping up is very slow in coming.
People who are positive need to know they're positive so they can self isolate and not infect the rest of us.
Thanks for posting. The charts showing all of the states are interesting and should help drive home the point that it's not just New York that is in trouble - they're just further along. If states don't take action to bend their curves, most of them will end up in similar circumstances. Next up seem to be New Jersey, Michigan, Louisiana, Illinois and Florida.lazuras_dc said:
http://www.91-divoc.com/pages/covid-visualization/?fbclid=IwAR0RsuuSqsswJnkGyAIqu-X249Lh9iyxaiEPP6ShR5mT2l8IyBmAN_VvFjc
More interesting charts
Honest question here....aren't we all isolating already?? If this thing is as contagious as some say, I find it hard to believe that say, in a family of 5, if one person has it, everybody has it. That's why I don't understand necessarily why it matters so much if you know you're positive or not....UNLESS you have other comorbidities etc. Self-quarantine as mandated...
I am very curious on what measures that the state of Washington has taken. Its numbers are very encouraging.
I found this really cool tableau interactive dashboard. You don't need tableau to use it.
https://public.tableau.com/profile/bh8084#!/vizhome/Coronavirus2020-Updated/PCorMac?publish=yes
https://public.tableau.com/profile/bh8084#!/vizhome/Coronavirus2020-Updated/PCorMac?publish=yes
Featured Stories
See All
38:51
1d ago
7.2k
77:19
21h ago
1.4k
Video Replay: Student Bonfire 2025
by TexAgs
5 Thoughts: Texas 70, No. 13 Texas A&M 69
by Luke Evangelist
1:29
8h ago
671