let's not stop there... let's check the numbers.
Home Attendance according to the NCAASome stats of note:
Top home attendance per team
Games/Attendance/Average per game
1. Michigan / 6 / 669,534 / 111,589
2. Ohio St. / 7 / 752,464 / 107,495
3. Penn St. / 7 / 746,946 / 106,707
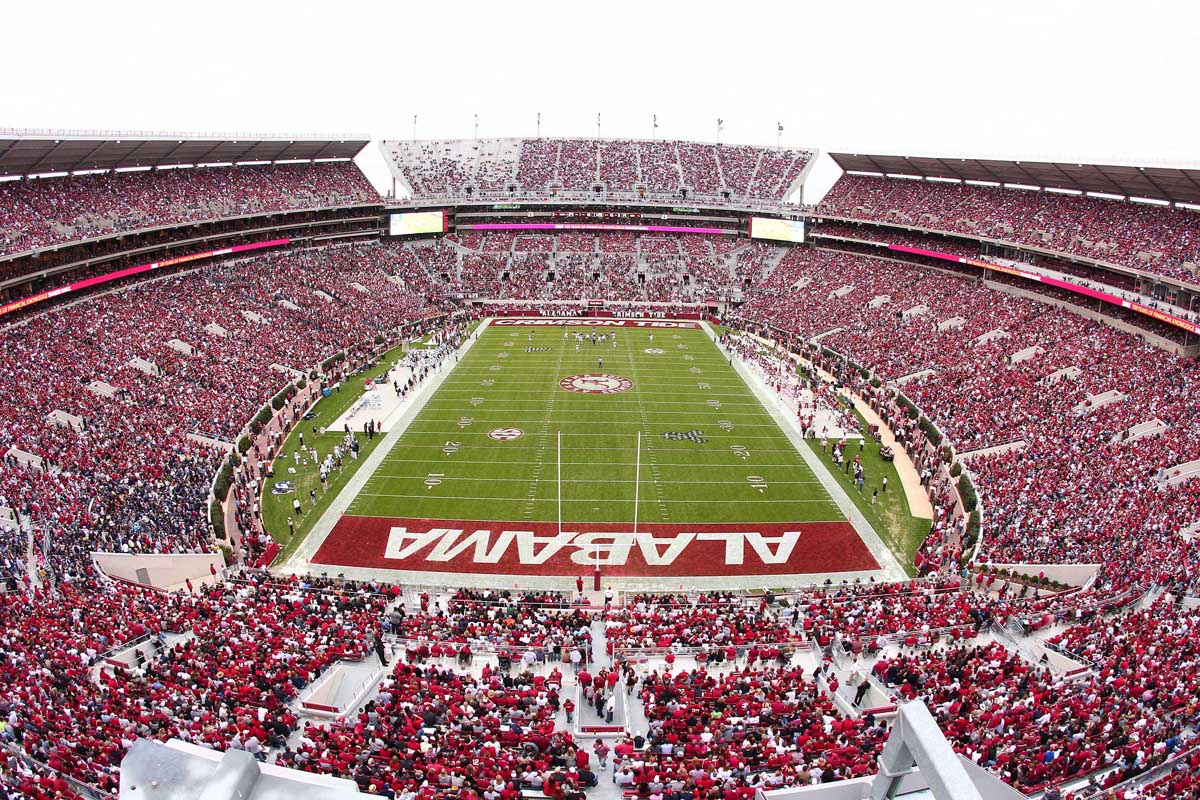
4. Alabama / 7 / 712,053 / 101,722
5. Texas A&M/ 7 / 691,612 / 98,802
6. LSU / 6 / 591,034 / 98,506
7. Tennessee / 7 / 670,454 / 95,779
8. t.u. / 6 / 556,667 / 92,778
9. Georgia / 6 / 556,476 / 92,746
10. Nebraska / 7 / 628,583 / 89,798
Top attendance per conference
Games/Attendance/Average per game
Southeastern / 98 / 7,357,228 / 75,074
Big Ten / 95 / 6,291,534 / 66,227
Big 12 / 65 / 3,695,374 / 56,852
Pac-12 / 79 / 3,918,463 / 49,601
Atlantic Coast / 93 / 4,505,142 / 48,442
Let's check the average attendance of some home games, shall we?
SEC
Average per game
Alabama / 101,722
Texas A&M / 98,802
LSU / 98,506
UT / 95,779
Georgia / 92,746
Florida / 86,715
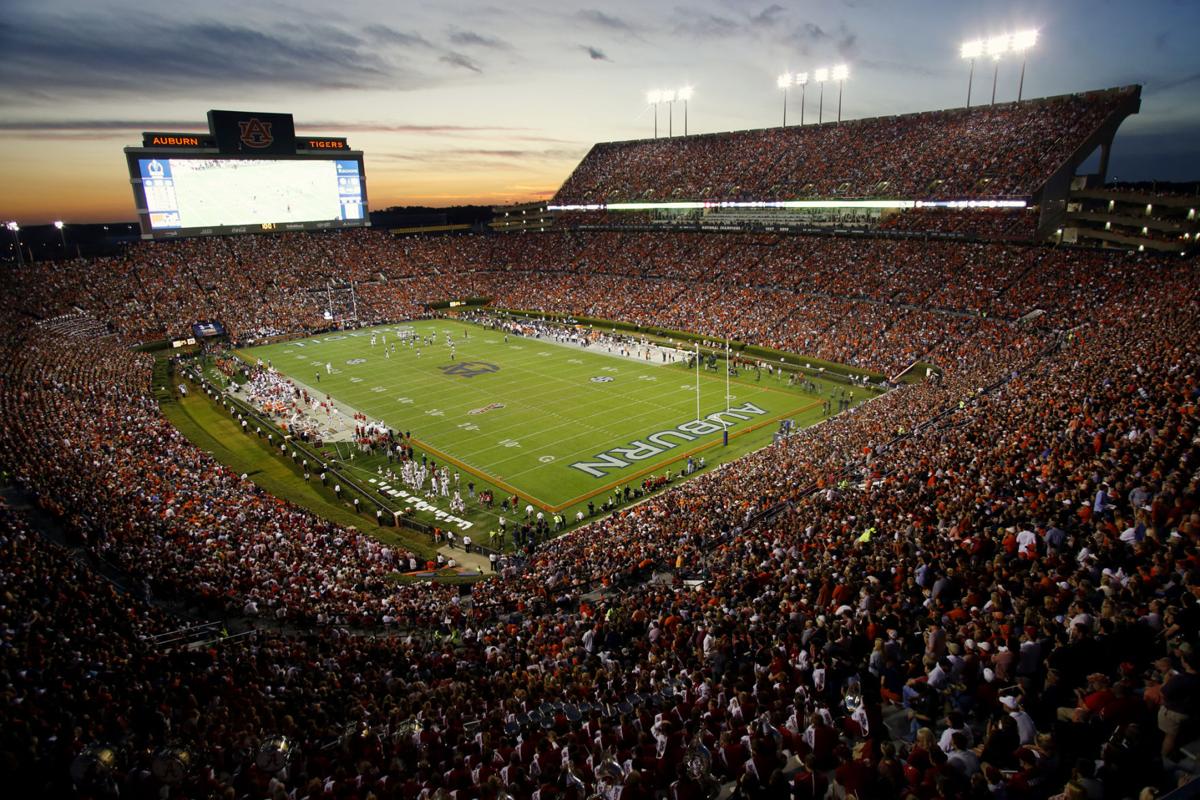
Auburn / 86,446
South Carolina / 78,586
Arkansas / 63,224
Ole Miss / 58,631
Miss State / 58,100
Kentucky / 56,468
Missouri / 51,490
Vanderbilt / 31,341
Big 12
Average per game
t.u. / 92,788
Oklahoma / 86,520
Iowa State / 57,931
Oklahoma State / 56,790
West Virginia / 55,946
Texas Tech / 55,065
Kansas State / 51,301
TCU / 44,080
Baylor / 43,830
Kansas / 26,641
The team with the third highest home attendance average in your **** conference would sit at 12th in the SEC.
No one is going to your games.
You were Texas.