Business & Investing
Sponsored by

Stock Markets

25,812,641 Views | 235230 Replies | Last: 6 min ago by Ragoo
mazag08
How long do you want to ignore this user?
AG
McInnis 03 said:

lobwedgephil said:

You obviously know what you are doing


Your premise was wrong.

This is why I'm in micros, single contract, maybe 2. My decision making is terrible and why things like this happen.
jimmo
How long do you want to ignore this user?
Checked the Sava Yahoo finance forum..
it's about as volatile as the stock.
maybe it's the Phase 3 trial we're waiting for?
(assuming today's isn't associated w/ phase 3)
sorry, I'm not sure
mazag08
How long do you want to ignore this user?
AG
jimmo said:

Checked the Sava Yahoo finance forum..
it's about as volatile as the stock.
maybe it's the Phase 3 trial we're waiting for?
(assuming today's isn't associated w/ phase 3)
sorry, I'm not sure
Sometimes trading is way easier than it seems it should be.

Go to the daily chart for SAVA. Look back to August 26 & 27 and tell me what you see. Once you find it, look at today's close price and notice where it is. Then look at shorter time frame candles and notice where today finished.

Once you realize what happened, do yourself a favor and look back at February 1st and 2nd. Now you realize how important it is to follow the short term trends closely. If this thing makes a lower low before a higher high.. look out below.

But don't get too sad. Because we've got Aug 24 & 25 to look at still. Once we swing these other moves, guess what follows? $$$$$$$$$$
Bird Poo
How long do you want to ignore this user?
AG
mazag08 said:

jimmo said:

Checked the Sava Yahoo finance forum..
it's about as volatile as the stock.
maybe it's the Phase 3 trial we're waiting for?
(assuming today's isn't associated w/ phase 3)
sorry, I'm not sure
Sometimes trading is way easier than it seems it should be.

Go to the daily chart for SAVA. Look back to August 26 & 27 and tell me what you see. Once you find it, look at today's close price and notice where it is. Then look at shorter time frame candles and notice where today finished.

Once you realize what happened, do yourself a favor and look back at February 1st and 2nd. Now you realize how important it is to follow the short term trends closely. If this thing makes a lower low before a higher high.. look out below.

But don't get too sad. Because we've got Aug 24 & 25 to look at still. Once we swing these other moves, guess what follows? $$$$$$$$$$

Assuming it does get to the lower low, what price range would be a good entry?

I'm loaded up on some MA stocks and never got into SAVA, but I do know the company and the risks, as well as the potential.
jimmo
How long do you want to ignore this user?
thanks Maz
mazag08
How long do you want to ignore this user?
AG
Prog and I have discussed this a lot deeper.. where he thinks all technicals get thrown out because of the short seller and the craziness over the last month.

Me being an Elliott Wave guy.. I see a VERY clear a-b-c correction from it's high. A high that was pumped up far beyond it's actual value based on EXPECTED future news. It couldn't possibly sustain that level while waiting for a Phase 3. And since EW is based on market sentiment and can be accurately traced using Fibonacci (the golden ratio), I see what's happening through an EW lense.

When you get a retracement off a big time high, it will normally take the shape of a-b-c with "a" being down, "b" correcting back up a portion of "a", and "c" being back down. This a-b-c usually subdivides into waves of 5-3-5. Sometimes 3-3-5.

When looking at SAVA since the ATH, we have a clear structure down (a), followed by a 3 wave structure up (b), and we are in the beginning stages of the 5th wave of a 5 wave structure to a lower low (c).

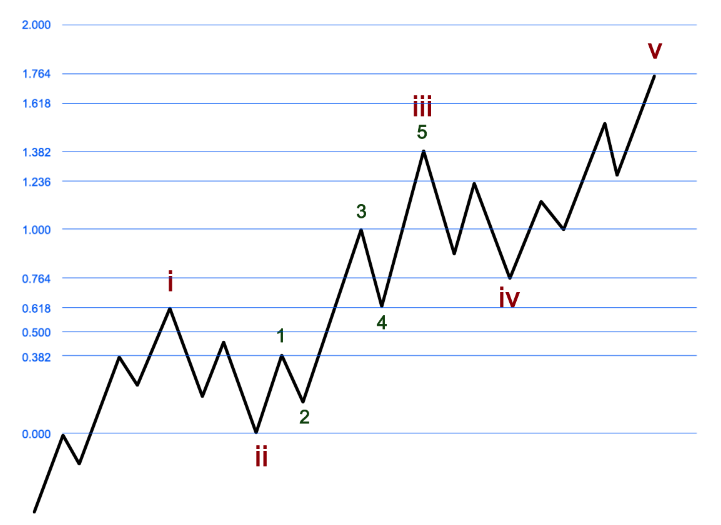
In a 5-wave structure, you can use Fibonacci extensions to plot your way. These will also subdivide into 5 wave structures. You start by placing your first click at the beginning of what you identify as your wave 1. Then you click at the top of wave 1, and then the bottom of wave 2. Your tool should fill out the extensions from there. You might need to modify the fib levels that show on your screen. But a typical 5 wave structure should look like this and hit these fibs..


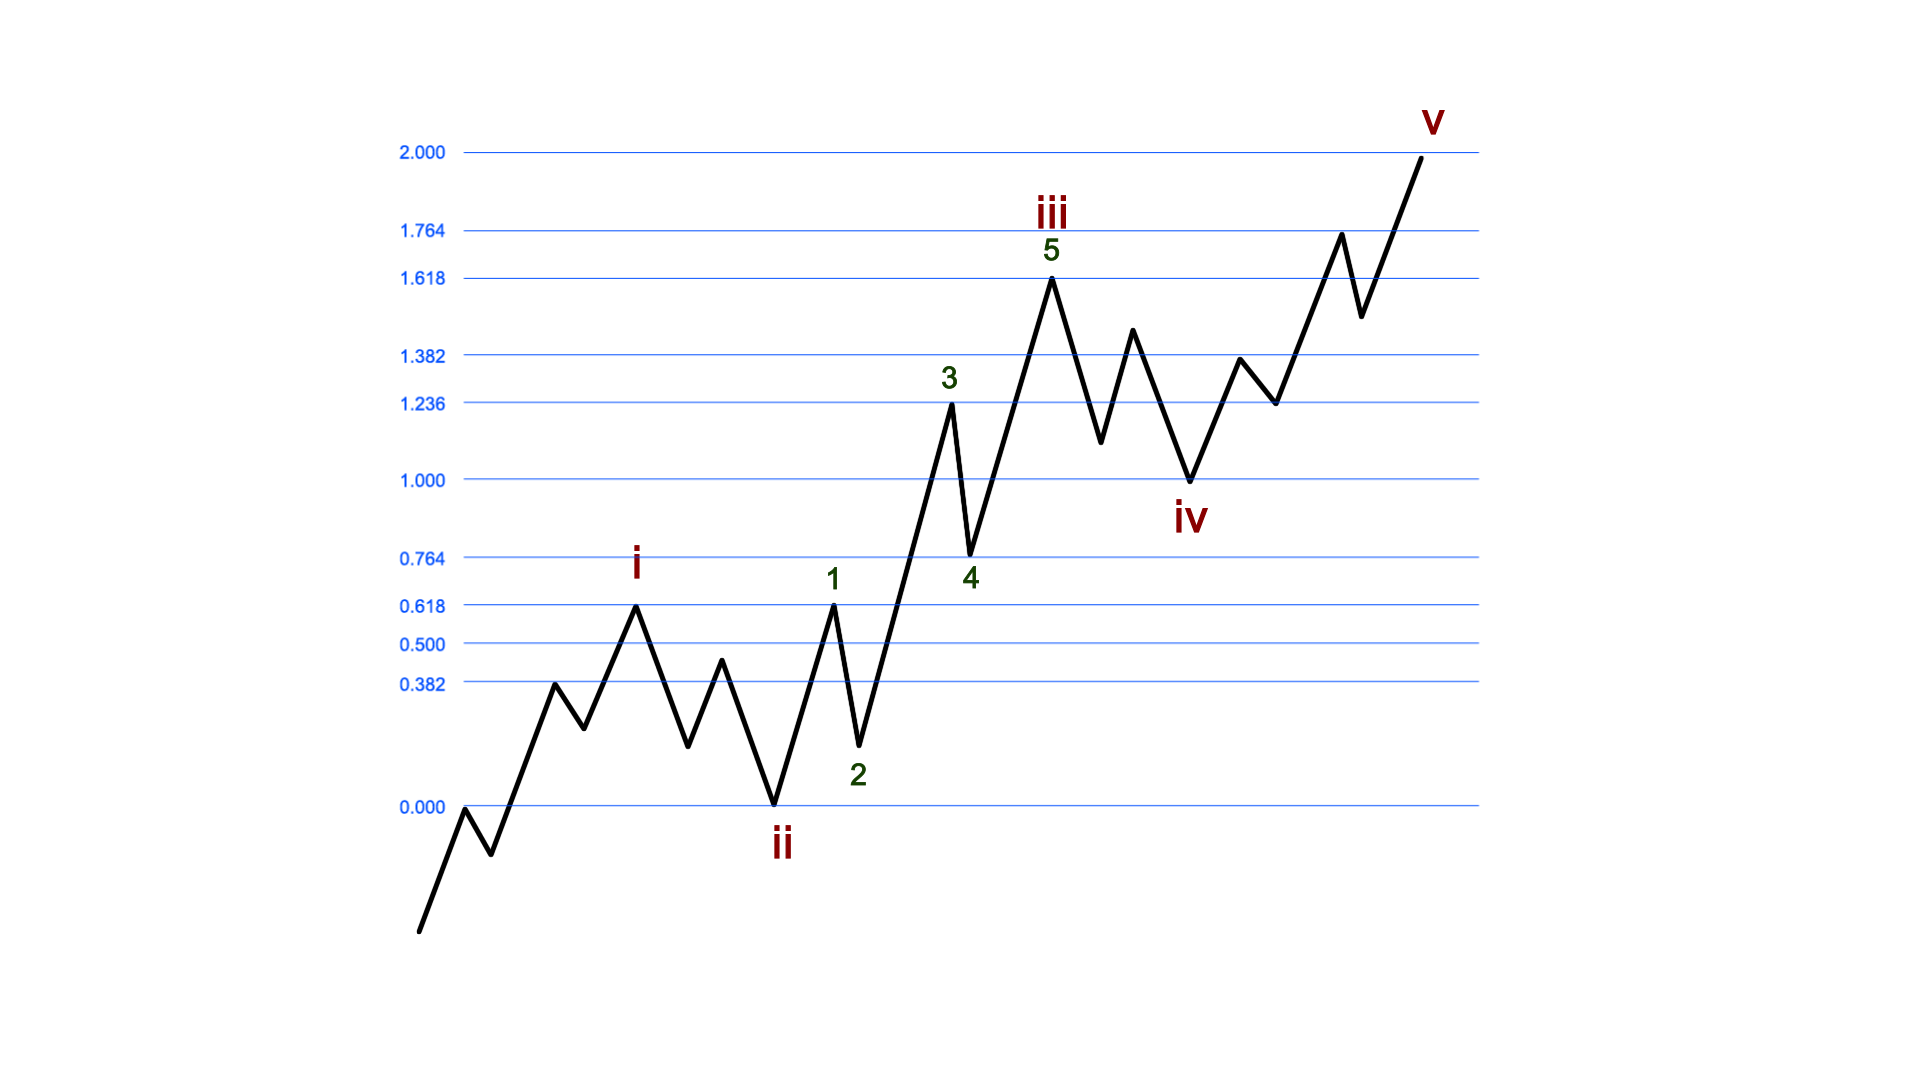
Another typical structure you will see will hit these fibs..


For SAVA's c-wave, we have the following fib hits..

Wave i
Wave ii
subwave 1 of iii - 38.2%
subwave 2 of iii - 23.6%
subwave 3 of iii - 100%
subwave 4 of iii - between 61.8% and 76.4%
subwave 5 of iii (Wave iii) - 123.6%

With subwave 5 coming up one fib level short of it's target, we then lower all future waves by one fib level. So we expected Wave iv to hit the 76.4% level, but it should now hit 61.8%. Well guess what it hit today? That also happens to be a bounce directly off the 610 EMA on the 55min chart.

So where we would normally expect Wave v to hit 176.4%, we now expect it to hit 161.8%. You'll never guess where that level lines up.. yup.. just below the lower level of the gap that needs $23.50 to get filled.

Timing wise, I've labeled some trendlines that show a descending wedge and pointing to early to mid October before it hits the low. This is also about the same time I have the current market correction bottoming.. where all of the major indexes look to be possibly putting in lows at the same time and starting new booms. But timing is HARD. It could ram through and hit lower by Friday. Who knows..

Call it wizard crap. Call it luck. Whatever. But if you see this thing start making lower lows again, you know where to look for it to finish.

Of course, EW isn't a guarantee. It just uses fib math and probabilities to map out the most likely scenarios. There needs to be an alternate count. My alternate is that what I'm calling the Wave iii is actually the bottom. And today's spike formed the top of a new Wave 1. I would need to see a higher low and then a break above today's high. But I need more to form before I can say that's a viable count.


$30,000 Millionaire
How long do you want to ignore this user?
AG
McInnis 03 said:

cptthunder said:

McInnis 03 said:

cptthunder said:

This is just wacky to watch SPY on the 1&5 minute right now
I was sitting in a parking lot eating my Jimmy Johns thinking, "maybe I should put in a limit buy on ES at 4376 just for the hell of it, I mean they love to F with people".......and sure enough that thing went to 4374 and I didn't do it.
That would have been a fun ride
Before that craziness I was down 29 pts on micro ES contracts, not much, $145 or so. After that little jaunt I finished up 6 pts total, so that was a 37pt swing.

I'm back into a phase of trying to prove futures only trading can be my way forward.....so the micros are my test subject at the moment.


Holy s man. I normally set my futures stops at -7 to -8 at the absolute upper end. -2 most of the time. I get it was MES, but sounds like you were playing small.
You don’t trade for money, you trade for freedom.
$30,000 Millionaire
How long do you want to ignore this user?
AG
On Sava, all I know is I've sold 60 total contracts of puts successfully over the last 3 weeks, and I plan to keep doing it until it won't work.
You don’t trade for money, you trade for freedom.
FJ43
How long do you want to ignore this user?

Mornun!

U.S. mostly green, EU & Asia mixed.


Let's see if we have a rally into the close of the week or we fade any of this slight green here.

Watch VIX....get back to and stay below 20 and we could be in business. Stays up and swings are in order IMO.

Rise and shine traders!


Trade wisely!


Wealth gained hastily will dwindle. but whoever gathers little by little will increase it.
Proverbs 13:11

59 South
How long do you want to ignore this user?
AG
$30,000 Millionaire said:

I mean what could possibly go wrong with this picture? This curve is so steep, we're about to go backwards in time.


Come on 30K! You know I mean no disrespect and this is in a fun/banter/respectful way, but any super long term chart not in log scale is absolute rubbish chart crime. What timeframe you talking about? You're gonna scare off all the newbs

For long term perspective, let me counter argue with the fact that historically, we have gone in approximately 30 year cycles through worries, massive inflation, wars, failing banks, scandals, terrorist attacks, etc... every generation thinks they're in the worst of times and 'it won't end well' etc.

The 30 year cycles have been about 2 decades of bull market (coinciding w/ the 18 year real estate market phenomenon) followed by about a decade of steep recessions essentially making macro Darvas boxes. 1950s-60s mega bull after regaining 1929 highs, 1970s terrible, 80s-90s mega bull after all the inflation and other global political craziness, 2000s terrible after dot com bust, 9/11, GFC... and the March 2000 high didn't get taken out for good until 2013... long term speaking we are mid channel/mid cycle and just kinking the chart into that final multi year blow off top leg. We'll have a few 20% drops along the way for sure...maybe I'm just hoping?!?


If this post is on the B&I forum, lighten up it's just money!

Disclaimer: I'm not that smart.
ProgN
How long do you want to ignore this user?
"Rubbish"
trip98
How long do you want to ignore this user?
AG
oldarmy1 said:

Sell all DOCN

Hello!


Great to see you again. I'm in M&A so hope you're having fun there

Question, i thought the play here was entry at 3.25 and Target of 6.50

What changed as it's right around 3.60-90???
BaylorSpineGuy
How long do you want to ignore this user?
Have a look at BMBL.

C&H formed with big volume spike about a week and a half ago. Good looking chart.
Engine10
How long do you want to ignore this user?
AG

"One good jobs number away from starting taper" … ain't seen it yet
59 South
How long do you want to ignore this user?
AG
ProgN said:

"Rubbish"
That was for you bro!
ProgN
How long do you want to ignore this user?
Quote:

Roku Raised to Buy From Neutral by Guggenheim
7:46 am ET September 23, 2021 (Dow Jones) Print

Ratings actions from Benzinga: https://www.benzinga.com/stock/ROKU/ratings


2021-09-23 11:46:00 GMT DJ Roku Price Target Announced at $395.00/Share by Guggenheim


Brian Earl Spilner
How long do you want to ignore this user?
AG
Nice movement premarket.
$30,000 Millionaire
How long do you want to ignore this user?
AG
I just think the market is extended. *Whilst* brrr happens, well, you know what will occur.
You don’t trade for money, you trade for freedom.
$30,000 Millionaire
How long do you want to ignore this user?
AG
UPWK 52.5C
You don’t trade for money, you trade for freedom.
FTAG 2000
How long do you want to ignore this user?
AG
Man ATER got hammered this morning.
$30,000 Millionaire
How long do you want to ignore this user?
AG
$CRM October 270C. Needs to hold breakout.
You don’t trade for money, you trade for freedom.
BrokeAssAggie
How long do you want to ignore this user?
PLTR looking like it wants a big move today.
LOYAL AG
How long do you want to ignore this user?
AG
$30,000 Millionaire said:

I just think the market is extended. *Whilst* brrr happens, well, you know what will occur.


This is an important thing to grasp. Money printing creates inflation which is good for the market in nominal terms meaning as long as we have inflation the meme "stonks only go up" has some truth to it. Printed money has to go somewhere and stocks are the only place it can generate return. So while everything we buy is getting more expensive the only hope we all have of keeping up is putting more and more into the market in the hope of keeping up. Endless loop that will end one day but most likely not today. The market can stay irrational longer than you can stay liquid.
A fearful society is a compliant society. That's why Democrats and criminals prefer their victims to be unarmed. Gun Control is not about guns, it's about control.
McInnis 03
How long do you want to ignore this user?
AG
ES and RTY running, NQ lagging a bit.
***If this post is on Business and Investing, take it with a grain of salt. I am wrong way more than I am right (but I am less wrong than I used to be) and if you follow me you will be too.***

B&I Key:
ETH - Extended Trading Hours --- RTH - Regular Trading Hours
ORH - Opening Range (1st 30min) High --- ORL - Opening Range Low
R1, R2, R3 - Resistance 1, 2, or 3 --- S1, S2, S3 - Support 1, 2 or 3
59 South
How long do you want to ignore this user?
AG
$30,000 Millionaire said:

I just think the market is extended. *Whilst* brrr happens, well, you know what will occur.
No doubt extended. I really wish we could get a back test of the 4000 breakout at least. I was hoping it would happen Sept-Oct, and maybe it still will. That's only a 12% correction from the top and would be good. Helps with DCA accounts too instead of propped up sideways consolidation.

But to be honest, I think there's a chance that 5-7 years from now, this zirp and QE house of cards is still going with a late 90s type meltup to like SPX pushing 15k. I always try to remember to not overthink it and keep an open mind.
$30,000 Millionaire
How long do you want to ignore this user?
AG
$30,000 Millionaire said:

$CRM October 270C. Needs to hold breakout.
up $1. Trim some.
You don’t trade for money, you trade for freedom.
Charismatic Megafauna
How long do you want to ignore this user?
AG
$30,000 Millionaire said:

UPWK 52.5C

In at 2.5
Let's ride!
McInnis 03
How long do you want to ignore this user?
AG
McInnis 03 said:

ES and RTY running, NQ lagging a bit.
NQ joined the party.
***If this post is on Business and Investing, take it with a grain of salt. I am wrong way more than I am right (but I am less wrong than I used to be) and if you follow me you will be too.***

B&I Key:
ETH - Extended Trading Hours --- RTH - Regular Trading Hours
ORH - Opening Range (1st 30min) High --- ORL - Opening Range Low
R1, R2, R3 - Resistance 1, 2, or 3 --- S1, S2, S3 - Support 1, 2 or 3
59 South
How long do you want to ignore this user?
AG
SPX gap closed
McInnis 03
How long do you want to ignore this user?
AG
Just so y'all can tell me how dumb I still am, I was down 29 cumulative MES points prior to open again.

Correction. 26 points. #Improvement #Inspire
***If this post is on Business and Investing, take it with a grain of salt. I am wrong way more than I am right (but I am less wrong than I used to be) and if you follow me you will be too.***

B&I Key:
ETH - Extended Trading Hours --- RTH - Regular Trading Hours
ORH - Opening Range (1st 30min) High --- ORL - Opening Range Low
R1, R2, R3 - Resistance 1, 2, or 3 --- S1, S2, S3 - Support 1, 2 or 3
Bob Knights Paper Hands
How long do you want to ignore this user?
AG 2000' said:

Man ATER got hammered this morning.

Most of that movement was premarket. It will be interesting to see where this one goes today and over the next few weeks. I bought a few shares so I could sell CCs if we get another pop.

Edit - as I type that it's formed a nice h and slamming down during cash session.
$30,000 Millionaire
How long do you want to ignore this user?
AG
Up $2, trimmed more in $CRM
You don’t trade for money, you trade for freedom.
Bob Knights Paper Hands
How long do you want to ignore this user?
I bought back those TSLA puts. Trimming my SPY calls.
59 South
How long do you want to ignore this user?
AG
Watch $AMD if it clears open high 105.13. 105 is a big level at daily falling wedge and there's lots of room up to 111.50-112
Brian Earl Spilner
How long do you want to ignore this user?
AG
I called $320 as a great entry for ROKU. Wasn't quite bottom but pretty close.
First Page Last Page
Page 4488 of 6721
 
×
subscribe Verify your student status
See Subscription Benefits
Trial only available to users who have never subscribed or participated in a previous trial.