I didn't trade this but I watched it. Sorry if you think this is "spiking the football" because I'm really not trying to do that. I just want to show some technical things that I have learned to look for over the years. I look at these charts like a big ass math problem that I'm trying to solve.
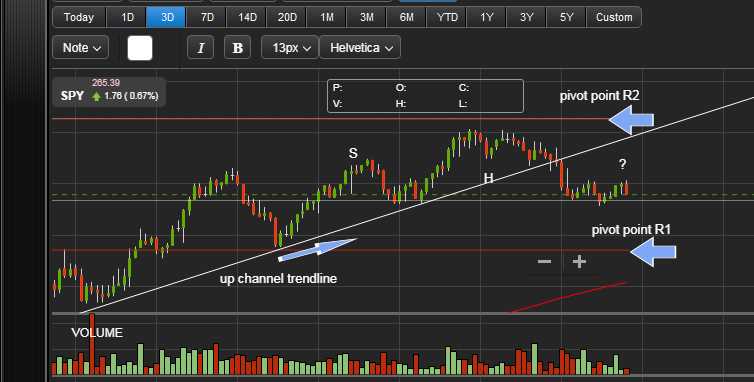
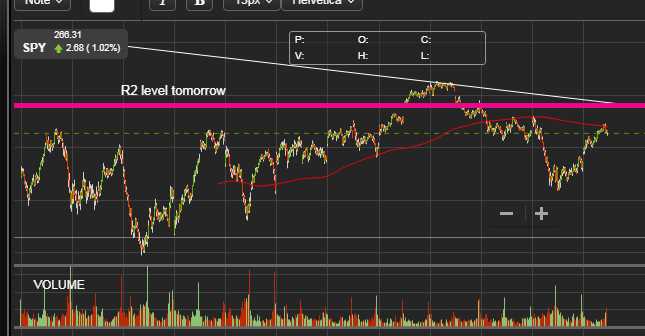
When the market opened I gave a low and high target based on what would happen at the R1 level. After we broke above it I was anticipating that the price would move to the R2 level (2661). As support came in on the trend line I drew it on the chart. We hit the R2 level (almost) and then broke the support trend line. This would obviously be a point to get out if I was long in the trade.
I think we will go back to the R1 level now and I'd be watching it closely. If we break below the R1 line which has shown to be intraday support/resistance then we very well might fall to 2628. Especially if we break through that resistance with a strong movement.
Set your stop just above the R1 level and have a target close to the PP.


