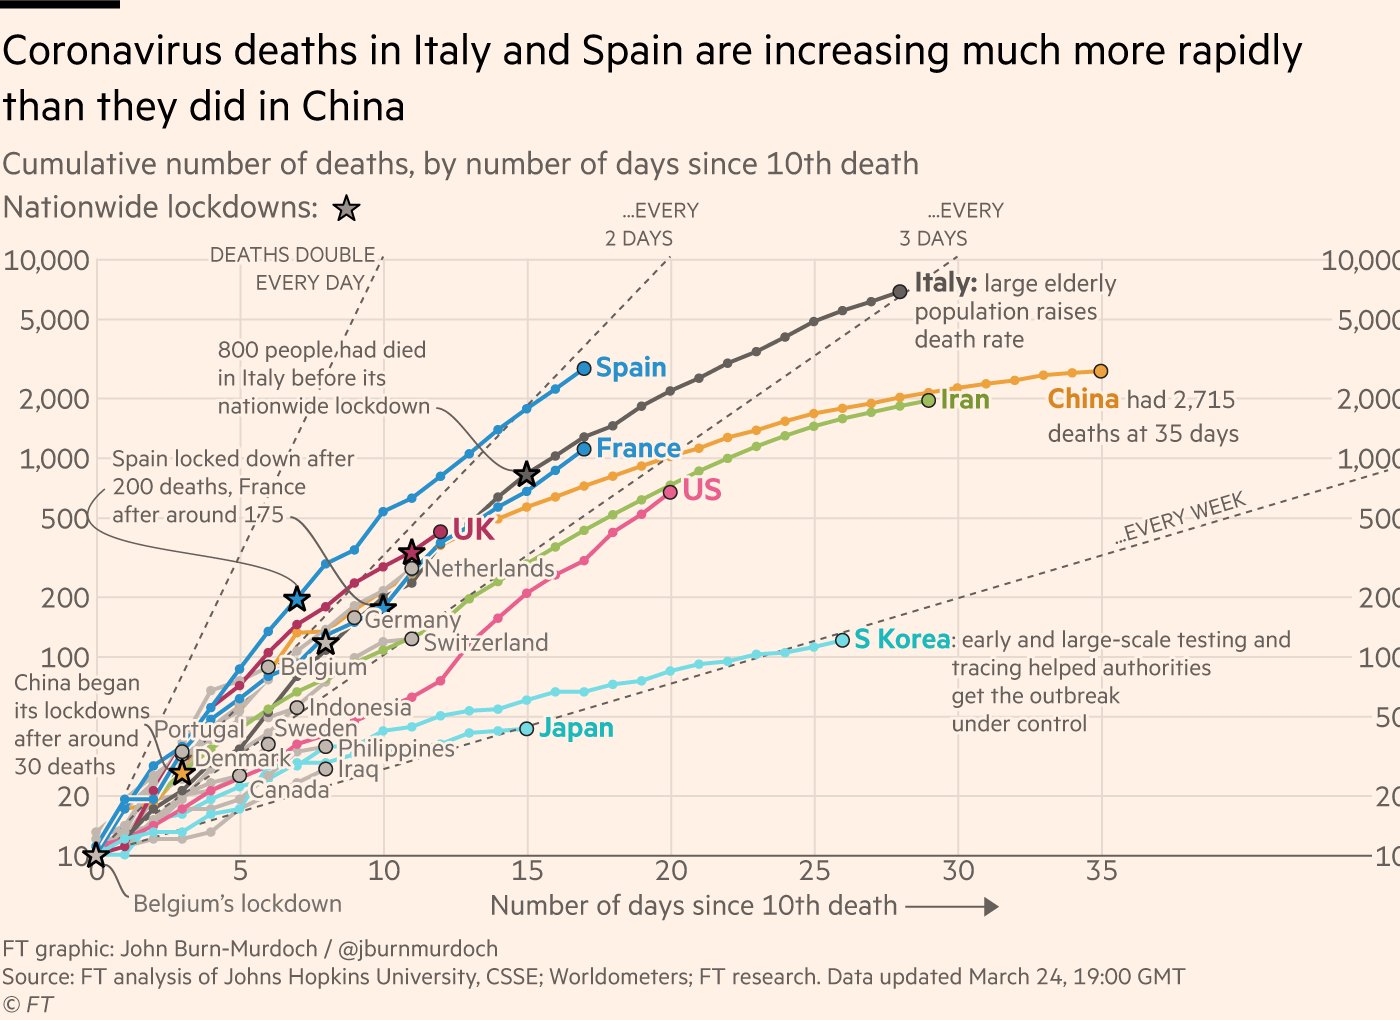
Something is growing exponentially at a constant rate if it is linear on a logarithmic graph.
As you can see, many places around the world, including the US, are still growing exponentially in terms of deaths attributed to COVID-19. Additionally, those countries who have flattened the exponential growth have achieved as much AFTER doing aggressive social distancing measures. Those measures did not show results until a couple weeks after they were implemented.
I'm not sure what this article is claiming to look at. The US confirmed cases graph can't grow exponentially forever, because of the limitation on testing. In a week's time at this pace we would expect new cases to go up higher than the daily testing capacity of our country.
Hopefully, we start to see deaths taper off their exponential path soon, but that would likely be due to all the measures that we have put into place, not due to an overblown analysis of the virus.
This video does a wonderful job explaining the math on the virus. You can see how social distancing and good sanitation would allow the growth of the virus to taper. The logistic curve it shows is exactly the curve we see now in SK and China.
me: what value did you get when you measured "x"? them: we got between the limits of the spec. me: yes, but what VALUES? them: acceptable me: how many did you measure? them: all me: you measured every piece? them: every piece we measured was acceptable. me: but HOW MANY did you measure? them: 500 me: you only shipped 200...
it goes on and on like this.. I imagine their coronavirus data goes through the same logic filter.
I like how most countries lines bounce around a little bit but China's is a perfectly smooth curve. Not suspicious at all.
Robk said:
Back in the early days of the outbreak there was a guy on Reddit that predicted the cases/deaths on a daily basis based on some common formula.
You don't have to believe China's numbers, but both of you are wrong. There's a ton of noise on that graph and overlapping plots so it's very difficult to see the random variance.
Something is growing exponentially at a constant rate if it is linear on a logarithmic graph.
As you can see, many places around the world, including the US, are still growing exponentially in terms of deaths attributed to COVID-19. Additionally, those countries who have flattened the exponential growth have achieved as much AFTER doing aggressive social distancing measures. Those measures did not show results until a couple weeks after they were implemented.
I'm not sure what this article is claiming to look at. The US confirmed cases graph can't grow exponentially forever, because of the limitation on testing. In a week's time at this pace we would expect new cases to go up higher than the daily testing capacity of our country.
Hopefully, we start to see deaths taper off their exponential path soon, but that would likely be due to all the measures that we have put into place, not due to an overblown analysis of the virus.
This video does a wonderful job explaining the math on the virus. You can see how social distancing and good sanitation would allow the growth of the virus to taper. The logistic curve it shows is exactly the curve we see now in SK and China.
What I ind interesting about SK and Japan is that they attributed to early testing.and tracing.
You know what is fundamental to that... Acceptance. No arrogance.
Leadership in both countries weren't going around brushing it off. They accepted the disease and the numbers from China. And begun testing and instituting drastic behavior changes.
The rest of the world arrogantly blew it off.
Lessons learned: 1) When china gives you bad news listen. It's likely worse. 2) When china gives you good news it's likely a lie covering something up.
Japan and South Korea have gone through this before with SARS and saw the writing on the wall. They had a pre-determined plan in place and pulled the trigger. I think that was the biggest factor.
Something is growing exponentially at a constant rate if it is linear on a logarithmic graph.
As you can see, many places around the world, including the US, are still growing exponentially in terms of deaths attributed to COVID-19. Additionally, those countries who have flattened the exponential growth have achieved as much AFTER doing aggressive social distancing measures. Those measures did not show results until a couple weeks after they were implemented.
I'm not sure what this article is claiming to look at. The US confirmed cases graph can't grow exponentially forever, because of the limitation on testing. In a week's time at this pace we would expect new cases to go up higher than the daily testing capacity of our country.
Hopefully, we start to see deaths taper off their exponential path soon, but that would likely be due to all the measures that we have put into place, not due to an overblown analysis of the virus.
This video does a wonderful job explaining the math on the virus. You can see how social distancing and good sanitation would allow the growth of the virus to taper. The logistic curve it shows is exactly the curve we see now in SK and China.
What I ind interesting about SK and Japan is that they attributed to early testing.and tracing.
You know what is fundamental to that... Acceptance. No arrogance.
Leadership in both countries weren't going around brushing it off. They accepted the disease and the numbers from China. And begun testing and instituting drastic behavior changes.
The rest of the world arrogantly blew it off.
Lessons learned: 1) When china gives you bad news listen. It's likely worse. 2) When china gives you good news it's likely a lie covering something up.
Both SK and Japan trusted but verified.
SK and Japan also learned a lot from SARS. It would be nice to be able to learn lessons from other countries mistakes, but that doesn't eliminate completely new mistakes that are unique to a system of rules we have in place.
Also, we blocked travel from China earlier than anyone else. That is a lesson we learned from our experience with SARS... don't let it in and you don't have a problem. Not the best lesson, because it didn't work this time.