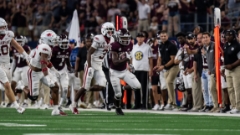
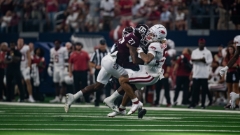
Also - our rush defense rank and Antonio Johnson's tackle forecast are absolutely positively correlated.

By the Numbers: Texas A&M 23, Arkansas 21
Here’s a statistical look, by the numbers, at the Aggies’ 23-21 win over Arkansas Saturday night at AT&T Stadium...
0 - Turnovers on offense over the last two games combined for the Aggies. After turning it over four times in the first two weeks, Max Johnson has helped settle things down and eliminated the careless mistakes that haunted A&M early... especially vs. App State in Week Two.
#2 - Devon Achane’s national ranking in kick return average. This season, Achane has five returns for an average of 39.6 yards per return and one touchdown. The only player in front of Achane in the national kick return average rankings is Miami’s Kay’Shawn Smith (40.1 Avg).
3 - Wins in a row for Texas A&M vs. top-10 opponents. That includes last year’s victory at home over No. 1 Alabama and the win over No. 5 Florida at Kyle Field in 2020. This is A&M’s first top-10 win away from Kyle Field since November 8, 2014, when the Aggies defeated No. 3 Auburn at Jordan-Hare Stadium, 41-38.
#4 - A&M’s national ranking in red zone touchdown percentage defense through four games. The Aggies limited the Razorbacks to just one touchdown in three red zone trips on Saturday, bringing their touchdown percentage in the red zone to 25 percent (three TDs in 12 red zone trips). That’s better than every Power 5 school other than Illinois. Additionally, the overall scoring rate in the red zone against the A&M defense is 58.3 percent, good enough for sixth nationally thus far.
8 - Top-15 wins for A&M under Jimbo Fisher. The Aggies have an 8-9 record under Fisher vs. top-15 opponents, but that number improved dramatically to 7-3 when facing top-15 opponents not ranked No. 1 or No. 2.

#8 - National ranking individually for Devon Achane in all-purpose yards. Achane averages 156 all-purpose yards per game (rushing, receiving, returning) through four games. That’s just 0.3 YPG behind Arkansas’ Raheim Sanders (156.3 YPG) for the SEC lead.
+10 - Scoring differential in favor of the Aggies in the red zone. The A&M offense was a perfect three for three inside the Arkansas 20-yard line, managing two touchdowns and a field goal. Meanwhile, the Razorbacks scored just seven points after crossing the Aggie 20-yard line and had the fumble that was returned for a touchdown.
11.8 - Points allowed per game defensively this season for Texas A&M. That’s good for eighth nationally thus far. Alabama, Georgia and Ole Miss are the only SEC teams allowing fewer PPG than the Aggies in ’22.
13.7 - “Havoc Rate” for the A&M defense in the game. Havoc Rate is an advanced metric from longtime stat man Bill Connelly that is determined by calculating the total number of tackles-for-loss, passes defended (including INTs) and forced fumbles divided by the total number of plays. The Aggies had 0 interceptions, one forced fumble, four pass breakups and five TFLs (two sacks and three run TFLs) vs. Arkansas. That’s 10 “Havoc points” divided by 73 defensive snaps for a game rating of 13.7, meaning that the Aggies created havoc on exactly 13.7 percent of the Razorbacks’ offensive snaps. On the season, A&M’s Havoc Rate is 13.7 (39 havoc plays/285 total plays). Last season, the Ags had a Havoc Rate of 17.8. It was 19.1 in ’20 and 18.6 in ’19. A&M ranked fifth in the nation in 2018 with a Havoc Rate of 20.4.
16.3 - Yards per catch for tight end Donovan Green. The freshman hauled in three impressive catches for 50 yards in the game, including an incredible sliding catch for 16 yards in the fourth quarter on third-and-12.
33.3% - Third down percentage for the Aggies on Saturday. A&M managed to go just 4-of-12 on third down, including a 1-of-7 showing in the first and fourth quarters. The Ags rank 76th nationally on third down, converting at just a 37.8 percent clip.
47.1% - Arkansas’ conversion rate on third and fourth vs. the A&M defense. The Hogs were 6-of-15 (40%) on third down and 2-of-2 (100%) on fourth down in the game. The Aggies rank 54th nationally in third-down defense (34.4%).
#100+ - A&M’s offensive ranking nationally in all four major categories. The Aggies rank 100th in rushing offense (128.75 YPG) and are exactly 108th in all three other categories, total offense (322.5 YPG), scoring offense (21.3 PPG) and passing offense (193.8 YPG).
#104 - A&M’s national ranking in run defense in 2022. The Aggies are allowing an average of 176.75 rushing yards per game. That’s 12th behind only South Carolina and Florida among SEC teams and 57th among the 65 Power 5 teams.

114 - Tackle pace this season for safety Antonio Johnson. The junior racked up 13 tackles against the Hogs on Saturday and has 38 tackles through four games. The last time an Aggie produced a 100-plus tackle season was 2017 when Tyrel Dodson had 105 tackles.
+133 - A&M’s yardage differential over Arkansas in the pivotal third quarter, which saw the Aggies out-gain the Razorbacks, 10-0 to take the lead for good. In that period, A&M racked up 154 yards of offense compared to just 21 yards for the Hogs. In the middle two quarters, the Aggies gained 278 total yards vs. just 131 yards for Arky (+147). A far cry from quarters one and four, where the Razorbacks out-gained the Ags, 284-65 (-219).
159 - Rushing yards for running back Devon Achane vs. the Hogs. The junior speed merchant ripped off a career-high 159 yards and a touchdown on the ground on 19 carries. He also added three catches for 15 yards. It’s the second straight game in which Achane had exactly 22 touches within the offense, averaging 6.9 yards per touch in two wins over then-top 15 opponents. Achane has also scored at least one touchdown in all four games this season. He has three rushing touchdowns, a receiving score and a kick return for a touchdown in 2022. The 63-yard run was Achane’s second-longest rush of his Aggie career and his third run of 60-plus yards.
A&M in national stat rankings
Team
• Time of Possession = #120 (26:30)
• Turnover Margin = #64 (Even)
• Penalties = #78 with 6.8 penalties per game
- #76 with 58.8 penalty yards per game
Offense
• Total O = #108 (322.5 YPG)
• Scoring O = #108 (21.3 PPG)
• Rushing O = #100 (128.75 YPG)
• Passing O = #108 (193.8 YPG)
• Yards Per Play = #55 (6.1 YPP)
• First Downs = #118 (16 PG)
• 3rd Down Conversions = #76 (37.8%)
• Red Zone TD% = #60 (66.7% - 4-of-6)
• Explosiveness = #99 (15 plays over 20 yards)
- #90 with 6 plays over 30 yards
- #51 with 4 plays over 40 yards
- #25 with 3 plays over 50 yards
- #5 with 3 plays over 60 yards
• Explosive Run Plays = #59 (5 plays over 20 yards)
- #60 with 2 plays over 30 yards
- #52 with 1 play over 40 yards
- #21 with 1 play over 50 yards
- #10 with 1 play over 60 yards
• Explosive Pass Plays = #10 (10 plays over 20 yards)
- #95 with 4 plays over 30 yards
- #44 with 3 plays over 40 yards
- #25 with 2 plays over 50 yards
- #3 with 2 plays over 60 yards
• Sacks Allowed = #70 (8)
• Tackles For Loss Allowed = #91 (24)
Defense
• Total D = #40 (330 YPG)
• Scoring D = #8 (11.8 PPG)
• Rushing D = #104 (176.75 YPG)
• Passing D = #10 (153.3 YPG)
• Yards Per Play Allowed = #21 (4.6 YPP)
• First Downs Allowed = #80 (20.8 PG)
• Opponent 3rd Down Conversions = #54 (34.4%)
• Opponent Red Zone TD% = #4 (25% - 3-of-12)
• Explosiveness Against = #11 (10 plays allowed over 20 yards)
- #8 with 3 plays allowed over 30 yards
- #20 with 2 plays allowed over 40 yards
- #29 with 1 play allowed over 50 yards
• Explosive Run Plays Against = #37 (3 plays allowed over 20 yards)
- #33 with 1 play allowed over 30 yards
- #55 with 1 play allowed over 40 yards
• Explosive Pass Plays Against = #10 (7 plays allowed over 20 yards)
- #6 with 2 plays allowed over 30 yards
- #16 with 1 play allowed over 40 yards
- #45 with 1 play allowed over 50 yards
• Sacks = #97 (6)
• Tackles For Loss = #95 (18)
• Interceptions = #109 (1)
• Fumble Recoveries = #35 (3)
Special Teams
• Field Goal % = #106 (50% - 3-of-6)
• Punting = #45 (44.0 Avg.)
• Kick Returns = #2 (39.6 Avg.)
- #1 in kick return TDs (1)
• Explosive Kick Returns = #17 (2 returns over 30 yards)
- #8 with 1 return over 40 yards
• Opponent Kick Returns Average = #49 (19.0 Avg.)
• Explosive Kick Returns Allowed = #1 (0 returns allowed over 30 yards)
• Punt Returns = #114 (3.4 yards per return)
• Explosive Punt Returns = #69 (0 returns over 20 yards)
• Opponent Punt Returns Average = #16 (1.6 Avg.)
• Explosive Punt Returns Allowed = #1 (0 returns allowed over 20 yards)
Individual
• QB Max Johnson = #93 in QG rating (126.62)
• RB Devon Achane = #32 in rushing yards per game (88.75 YPG); #78 in rushing TDs (3); #35 in total yards from scrimmage (106.5); #8 in all-purpose yards (156 Avg.)
- #2 in kick return average (39.6 Avg.)
• WR Ainias Smith = #57 in receiving yards (291); #28 in yards per catch (19.4 Avg.); #85 in receiving TDs (2)
- #66 in punt return average (3.4 Avg.)
• DL Albert Regis = #5 in kicks/punts blocked (1) LB Andre White = #32 in forced fumbles (1)
• DB Antonio Johnson = #23 in tackles (38)
• DB Tyreek Chappell = #29 in PBUs (4); #46 in passes defended (4)
• DB Demani Richardson = #4 in forced fumbles (2)
• PK Randy Bond = #73 in field goal % (66.7% - 2-of-3)
• PK Caden Davis = #30 in kickoff average (64.1 Avg.); #4 in touchback % (88.9%)
• P Nik Constantinou = #31 in punting average (44.0 Avg.)


