
Hmmmm....Warren B just bought $1 billion in Phillips 66. Worth looking into...
Dow 6,000 in 2016 or Dow 31,000 in 2017 ????
9,236 Views |
54 Replies |
Last: 10 yr ago by oldarmy1
What typically happens to the stock market at the end of a 15 year stretch of the Fed holding interest rates at virtually zero?
We don't know, because no country's federal reserve has ever done such a thing ever before.
There have been a few dramatic singularities in the US stock market before and we may be setting ourselves up for another singularity that does not follow all the previous metrics.
We don't know, because no country's federal reserve has ever done such a thing ever before.
There have been a few dramatic singularities in the US stock market before and we may be setting ourselves up for another singularity that does not follow all the previous metrics.
Warren B said as long as it's under $82 he will buy and has bought around 5 million shares a day for 3 weeks straight and still hasn't stopped. Said he has a lot of faith in the management and trusts them.
FYI Garland is class of 80' and A&M took over as the most employees in the company which was held by OU and OSU due to the heavy Oklahoma presence. A lot of upper management Aggies and since the spin off A&M has been the school Phillips 66 has recruited the best at for all majors. May be a longer term investment but very undervalued as investors still react to it like other oil companies.
FYI Garland is class of 80' and A&M took over as the most employees in the company which was held by OU and OSU due to the heavy Oklahoma presence. A lot of upper management Aggies and since the spin off A&M has been the school Phillips 66 has recruited the best at for all majors. May be a longer term investment but very undervalued as investors still react to it like other oil companies.
Got in at 74.10. Nice jump today
Looks like the S&P is in a trading range of 1800 to 2100 to me...maybe more like 1800-1900 the last week or so.
The markets bounced back today. I think part of it is where else do you put your money? Real Estate, collectibles, currencies, I guess...but risks there too. A lot of cash for now, but not good for long periods.
The markets bounced back today. I think part of it is where else do you put your money? Real Estate, collectibles, currencies, I guess...but risks there too. A lot of cash for now, but not good for long periods.
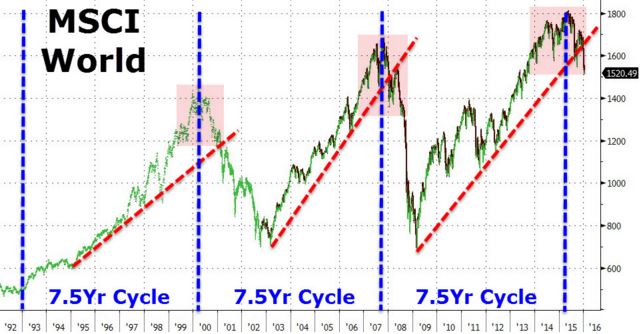
The market is down 9.61% year to date. That's after today's near 2% rally. Prior to today it was down 11.75% for the year. That's in 29 trading days. It's down almost 80% more today than it was at the end of January. The other day I came across this chart in a blog entry on Zerohedge. Now that's a notoriously doom and gloom site but nonetheless this is interesting to me.
I think if the market fails to stay above 10% down that we're in for another substantial leg down.
I think if the market fails to stay above 10% down that we're in for another substantial leg down.
^ That chart is consistent with Ray Dalio's "Economic Engine" definition, where the short-term debt cycle lasts about 6-8 years. Wouldn't Fed negative interest rates hinder de-leveraging?
Slacker
Good question. I'm certain I don't know what to think about negative interest rates other than it's a terrible idea. What I find interesting about that chart is that the first major pullback was about 50% of the peak before resuming the climb. The second one however was substantially all of the gains that had been made in the second run up. I had believed that the fall we're headed into would be to about 1200 but now I'm not so sure. Could we see 1000 or lower? The global economy is in shambles so I guess it's fair to ask if there is a floor to this pull back. I do believe that 2016 isn't the year to be in the market.
Good question. I'm certain I don't know what to think about negative interest rates other than it's a terrible idea. What I find interesting about that chart is that the first major pullback was about 50% of the peak before resuming the climb. The second one however was substantially all of the gains that had been made in the second run up. I had believed that the fall we're headed into would be to about 1200 but now I'm not so sure. Could we see 1000 or lower? The global economy is in shambles so I guess it's fair to ask if there is a floor to this pull back. I do believe that 2016 isn't the year to be in the market.
quote:
The market is down 9.61% year to date. That's after today's near 2% rally. Prior to today it was down 11.75% for the year. That's in 29 trading days. It's down almost 80% more today than it was at the end of January. The other day I came across this chart in a blog entry on Zerohedge. Now that's a notoriously doom and gloom site but nonetheless this is interesting to me.
I think if the market fails to stay above 10% down that we're in for another substantial leg down.
9/11 bombing
08 housing/financial collapse.
You're correlating two MAJOR events that were 7 years apart both of which preceded by bull markets..
7 years is just a coincidence...by far, not the cause...
Lines don't lie, especially lines drawn at varying degrees, intercepts, and lengths.
quote:If 9/11 had caused the first major drop you might have a point. BUT it didn't. My rough research shows me that the S&P peaked with an intraday high of 1534.63 on March 27, 2000, nearly 18 months before 9/11. The close on September 10, 2001 was 1092.54 ;which was down about 29% from that peak or over half of the total decline. The market looks like it bottomed at 775.80 intraday on October 9, 2002. So there was a decline that lasted over two years which was quite obviously pushed along by 9/11 but well over half of the decline (58% to be specific) happened prior to the attacks.quote:
The market is down 9.61% year to date. That's after today's near 2% rally. Prior to today it was down 11.75% for the year. That's in 29 trading days. It's down almost 80% more today than it was at the end of January. The other day I came across this chart in a blog entry on Zerohedge. Now that's a notoriously doom and gloom site but nonetheless this is interesting to me.
I think if the market fails to stay above 10% down that we're in for another substantial leg down.
9/11 bombing
08 housing/financial collapse.
You're correlating two MAJOR events that were 7 years apart both of which preceded by bull markets..
7 years is just a coincidence...by far, not the cause...
The trigger for the first decline is not 9/11 but instead the dot com bubble bursting. The trigger for the second decline is the housing bubble bursting. Both of those are very much financial events caused by distortions of the economy for various reasons and how you can discount them as causes of market movement is confusing to me. Markets respond to lots of things and in these two cases they responded to huge amounts of cash being pumped into vaporware and to huge amounts of cash being pulled out of mythical home equity. Those are economic events that as they exhausted themselves created major market movement.
The economy is again distorted and has been for this entire bull run, caused primarily by the printing of currency to maintain liquidity and generate faux growth. Now after seven years of 0% interest rates a whopping .25% increase has triggered a 10% drop in the S&P that has the Fed floating the idea of negative interest rates. If you don't take all of that to mean that we could be staring down the barrel of another major pull back in the market then that's fine. None of us have a crystal ball. I'm just suggesting that the past two major collapses happened after a run up that lasted roughly 7-1/2 years and that it's been about that long for the current run up. Do with that information what you may.
bump
quote:Are you thinking a point is being made with the
bump

Exactly what would that point be; that we are in between both of those extremes??
the real question is if we will have another bubble and will it be worse ?
I'm thinking yes
Just that Phillips was at 73 when I said that and now it's at 86. That was it. The real question is when to get out because it always crashes with oil even if it shouldn't because too many people still associate it with ConocoPhillips
Looks like we're back at lotto fever. Just buy anything.
minor note: I see a lot more folks saying 6k than 31k. I am not sure I have seen one say 31k unless it was several years ago.
I think both extremes will be wrong, but my guess is as good as theirs.
I think both extremes will be wrong, but my guess is as good as theirs.
quote:That's exactly the feeling the next step is waiting for.....need more of this so 17350-17500 looks ripe
Looks like we're back at lotto fever. Just buy anything.
If there is a style of trading that I like most, it is probably yours. I also saw an article that the #1 technical trader is saying very similar things as you have been (nearing a top and then down).
I find it somewhat interesting that as we run up quickly, it is the lotto mentality, but when we drop quickly, it is that the market is more reasonable priced now. It is completely opposite of when it drops, it is fear based, but when it runs up, it is because the market is more reasonably priced.
You can exchange out the reasoning with something else, but one is based on an emotion and the other is on what the person thinks is fact.
Amen Harkrider. AMEN!
Featured Stories
See All
13:47
6h ago
2.2k
TexAgs Internship Program
by TexAgs
Bethel-Roman found motivation through frustrations
by Olin Buchanan
Grading Bucky McMillan's debut campaign at A&M
by Luke Evangelist
14:12
18m ago
353
Long ball leads the way as Aggies dominate Sam Houston, 18-3
by Kayla Gaither