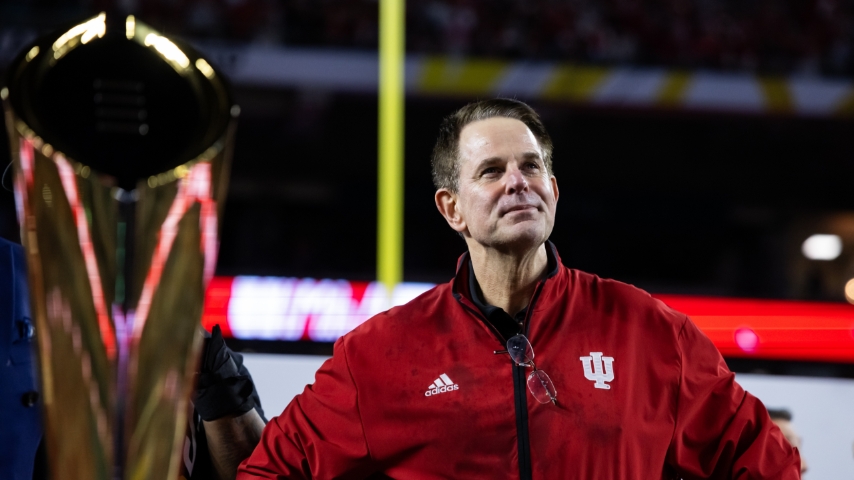
Two years removed from a mere three-win finish, Indiana has climbed to the top of the college football mountain under coach Curt Cignetti.
Texas A&M has been trying to scale that same mountain since 1939.
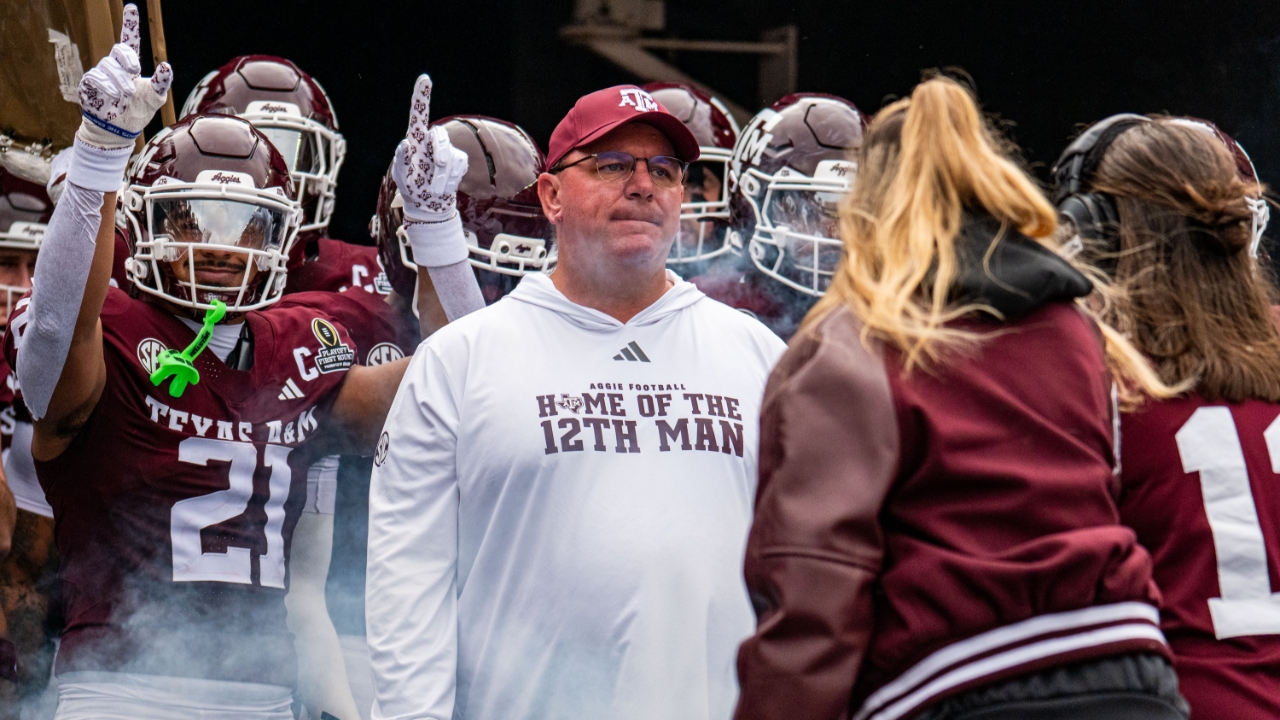
In many ways, the Aggies — in two seasons under coach Mike Elko — are closer than some may realize.
For example, A&M and Indiana were both undefeated through 11 games. Overall, the Aggies averaged just six fewer yards of total offense than Indiana. Also, A&M led the nation on third-down defense, while Indiana was eighth.
However, coaches often point out that the statistics usually convey the difference between victory and defeat are turnovers, big plays, red-zone success and third-down conversions. Quarterback performance plays a major role in those categories.
The kicking game and penalties frequently are big factors in winning, too.
Mark J. Rebilas-Imagn Images
Curt Cignetti is 27-2 in two seasons at Indiana. He wins. Google him.
With that in mind, here’s a comparison between Indiana and Texas A&M in 10 statistical categories.
It shows how close A&M is to being championship level in some areas and how much more they must climb in others:
1. Turnover Margin: Indiana led the nation with plus-22 turnovers. The Hoosiers claimed 30 (11 fumbles, 19 interceptions), while committing just eight (one fumble, seven interceptions).
A&M was 120th in the nation with a minus-nine margin. The Aggies gained 10 turnovers (seven fumbles, three interceptions) while committing 19.
Indiana’s 19 interceptions tied Maryland for the sixth most in the country. A&M’s three tied Rice for the second-fewest. Only Cincinnati, with two, had fewer interceptions.
2. Quarterback Play: High-level quarterback play is essential for championship teams.
Few quarterbacks have played at a higher level than Indiana’s Heisman Trophy-winning Fernando Mendoza. He passed for 3,535 yards. More importantly, he threw 41 touchdowns and only six interceptions. Simple math shows that’s a plus-35 touchdown-to-interceptions ratio.

Brad Penner-Imagn Images
Fernando Mendoza became the first Indiana Hoosier to win the Heisman Trophy.
A&M’s Marcel Reed was very comparable to Mendoza in passing yardage. He threw for 3,169 yards in three fewer games, but Reed threw 25 touchdown passes and 12 interceptions for a plus-13 touchdowns-to-interceptions ratio. Six of those interceptions were plays snapped at the opponent's 21-yard line or closer.
If Reed cuts his interceptions total in half, the Aggies — at least, theoretically — would take a giant step forward in the pursuit of a national title.
3. Scoring Offense: Indiana averaged 41.6 points to rank third in the nation in points scored.
A&M wasn’t bad. The Aggies averaged 33.8 points, which was 19th nationally.
But Indiana was more consistent. Both teams completed their seasons against Miami. Indiana scored 27 points (20 offensively) in a victory.
A&M scored just three in a loss.
4. Scoring Defense: There was a significant difference here. Indiana was second in the nation, allowing 11.7 points per game. Only three opponents scored more than 20 points.
A&M allowed about 10 points more per game to rank 36th. Seven opponents scored more than 20 points. Three scored at least 30.
Will Huffman, TexAgs
Taurean York led the Aggies in tackles this season with 72.
5. Explosive Plays: There can be varied definitions of explosive plays. For this exercise, let’s focus on plays from scrimmage that gain 10 yards or more.
Indiana was ranked third in the nation with 249 such plays. Of those, 97 were rushing plays, and 152 were passes.
A&M wasn’t far behind. The Aggies were 18th nationally with 207 plays (71 rushes, 136 passes).
Take that to the next step for plays of 20 yards or more. A&M had 69 plays to Indiana’s 65, and the Aggies had three fewer plays.
That indicates the Aggies, in that category, were championship level.
6. Preventing Explosive Plays: Indiana was 21st in the nation in allowing plays of 10 yards or more with 141 (27 rushing, 114 passing).
A&M was 43rd with 155 long plays surrendered (65 rushing, 90 passing).
On plays of 20 yards or more, A&M gave up 57 (21 rushing, 36 passing). Indiana allowed 53 plays of at least 20 yards (12 rushing, 41 passing).
Clearly, giving up big plays was a problem for the Aggies, but you already knew that.
Will Huffman, TexAgs
Cashius Howell posted 11.5 sacks to led Mike Elko’s defense.
7. Red-Zone Conversions: Indiana was 92.2 percent in the red zone. That was ranked eighth. The Hoosiers scored 71 times on 76 chances. They had 56 touchdowns and 15 field goals.
The Aggies were 92nd with an 81.03 percentage. They scored on 47 of 58 opportunities with 36 touchdowns and 11 field goals.
8. Third-Down Conversions: Indiana led the nation in third-down conversions. The Hoosiers converted on 113 of 200 third-down situations. That’s 56.5 percent.
A&M wasn’t bad in that regard. The Aggies were ranked 54th with a 41.28 percent success rate. They converted on 71 of 172 third downs.
By the way, the last 10 national champions all were ranked among the nation’s top 40 on third down. Six were in the top 10.
9. Field Goals: Place kicking is easily overlooked until there are problems converting field goals. Don’t Aggies know it?
Indiana had few problems. Kickers Nico Radicic and Brendan Franke combined to convert 19 of 21 field goal attempts. That’s a 90.5 percent success rate, which was ranked ninth.
By comparison, A&M kickers Randy Bond and Jared Zirkel made 16 of 26 field goal attempts for 61.5 percent, which was ranked 123rd.
10. Penalties: Indiana was penalized an average of 3.8 times for just 27.6 yards per game. That was second in the nation.
A&M was 99th. The Aggies averaged 7.2 penalties for 60.7 yards in losses.
To be fair, some championship teams were heavily penalized. LSU’s 2019 national championship team averaged 6.2 penalties for 62.4 yards. That was 107th in the country.