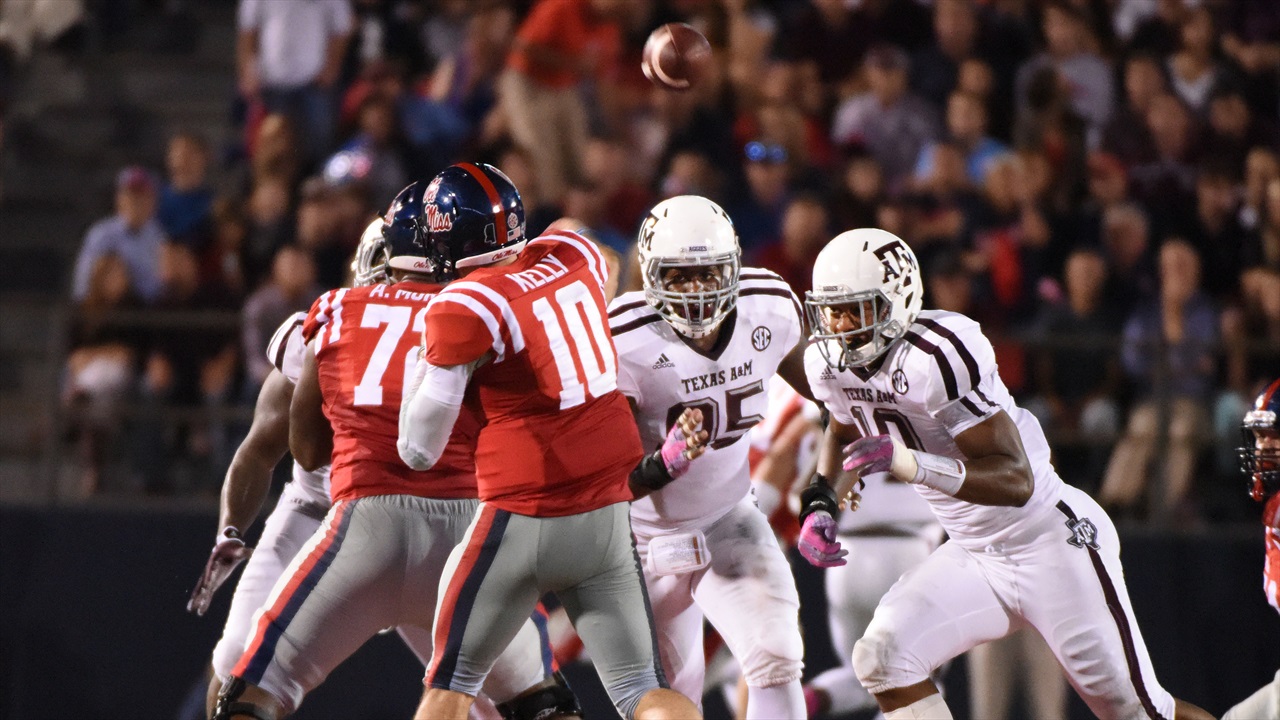
Photo by Brandon Jones, TexAgs.com
Texas A&M Football
• Defensively, this would be the percentage of plays you allow that to happen — so a lower number is better on defense.
Offensive efficiency vs. Ole Miss: 25.7 (Average team: ~42; A&M 2014: 46.4)
Breakdown by quarter:
1st: 35
2nd: 23.
Inside the Numbers: Advanced stats for Texas A&M-Ole Miss
October 25, 2015
4,776
Efficiency
• Defined as getting 50 percent of necessary yards to gain on first down, 70 percent on second down and 100 percent on third and fourth down (moving the sticks).• Defensively, this would be the percentage of plays you allow that to happen — so a lower number is better on defense.
Offensive efficiency vs. Ole Miss: 25.7 (Average team: ~42; A&M 2014: 46.4)
- 48.0 and up = A-level (top 10-15 nationally)
Breakdown by quarter:
1st: 35
2nd: 23.
Never miss the latest news from TexAgs!
Join our free email list